Composable Marketing Automation Strategy with a Digital analytics measurement model
")
In this blog post, we’ll explore how to effectively track and measure key digital performance metrics throughout the customer journey. Using Annie, our example user, we’ll identify critical metrics and discuss methods for integrating them into a comprehensive reporting solution.
For reference, this is our persona and customer journey – https://miro.com/app/board/uXjVKXuhzm4=/?share_link_id=840977045761
Awareness phase
At this initial stage of the journey, we encounter Annie as an unknown visitor to our website. If we are using paid digital acquisition programs, we should be tracking metrics such as cost per click (CPC), click through rate (CTR), and cost per acquisition (CPA). Our paid digital marketing platforms will make these metrics available to us. Often we would need to have any relevant tracking pixels installed on our website e.g. using Google Tag Manager.
For organic search, we should leverage Google Search Console to get data and insights into how visitors are finding their way to our site. Tracking impressions and CTR are two of the important metrics to review. Our objectives in reviewing organic search performance metrics is twofold: understand the volume of organic search traffic opportunity (impressions), and, increase the conversion of that opportunity (CTR) through more effective and highly ranked search results.
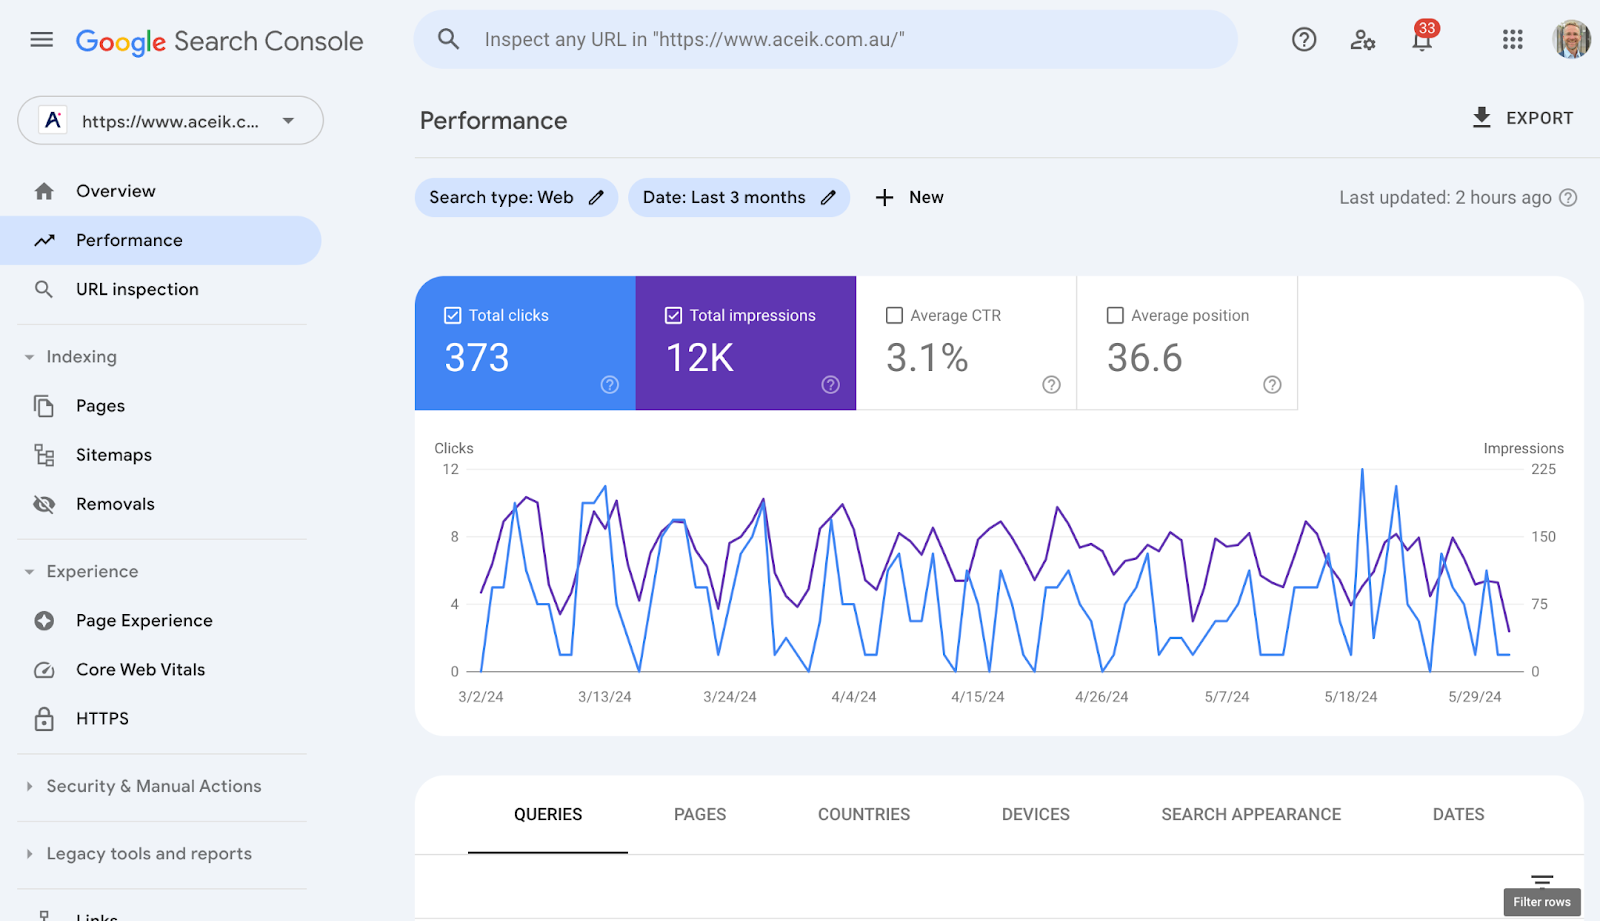
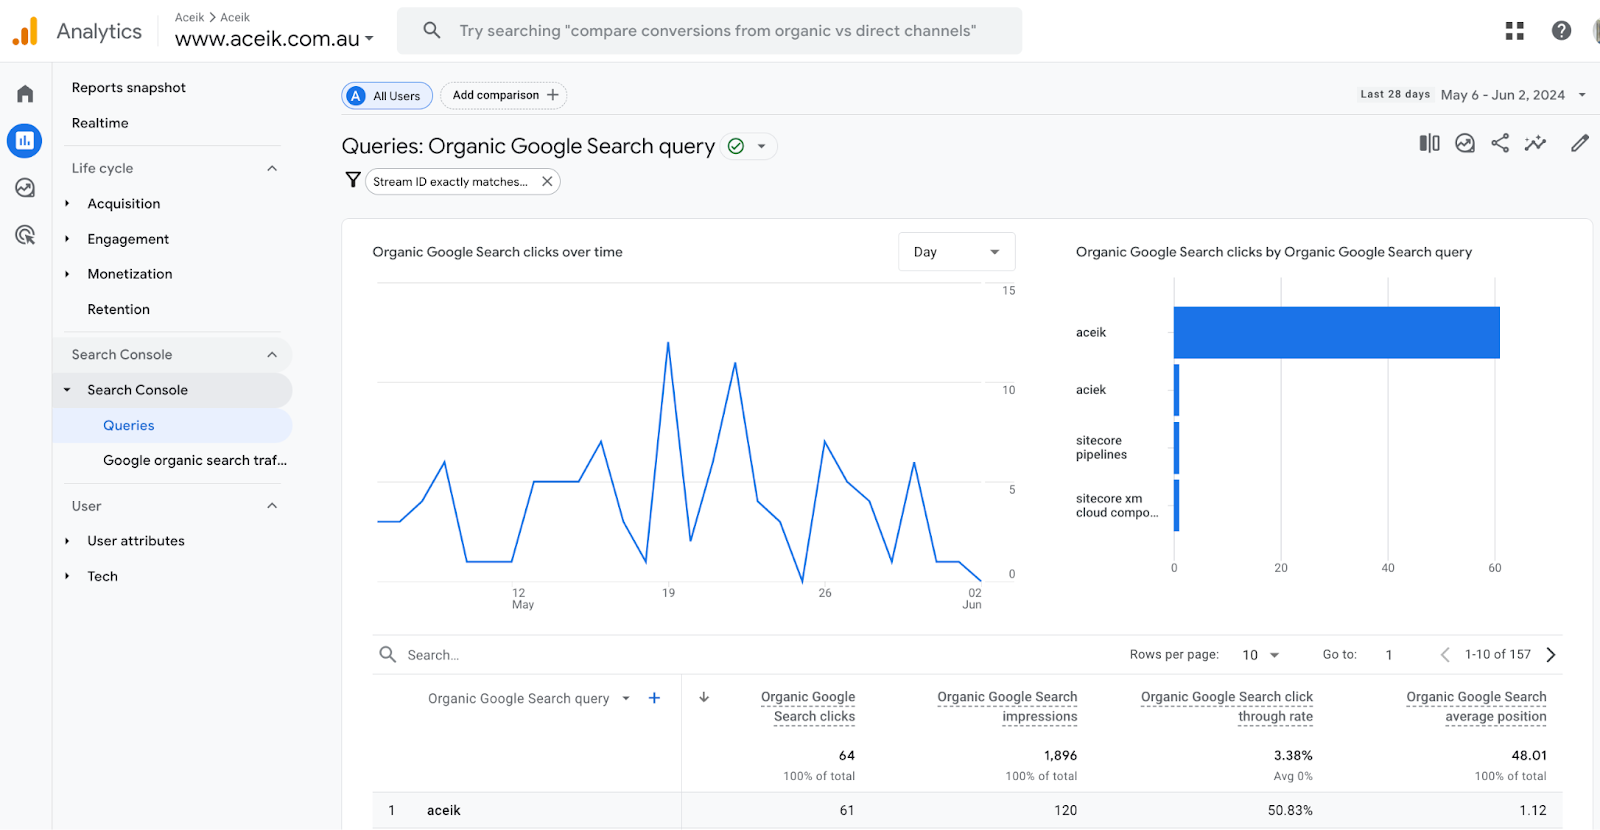
Whilst you can access these metrics directly within Google Search Console (GSC), you can also link your GSC data to make it available within Google Analytics.
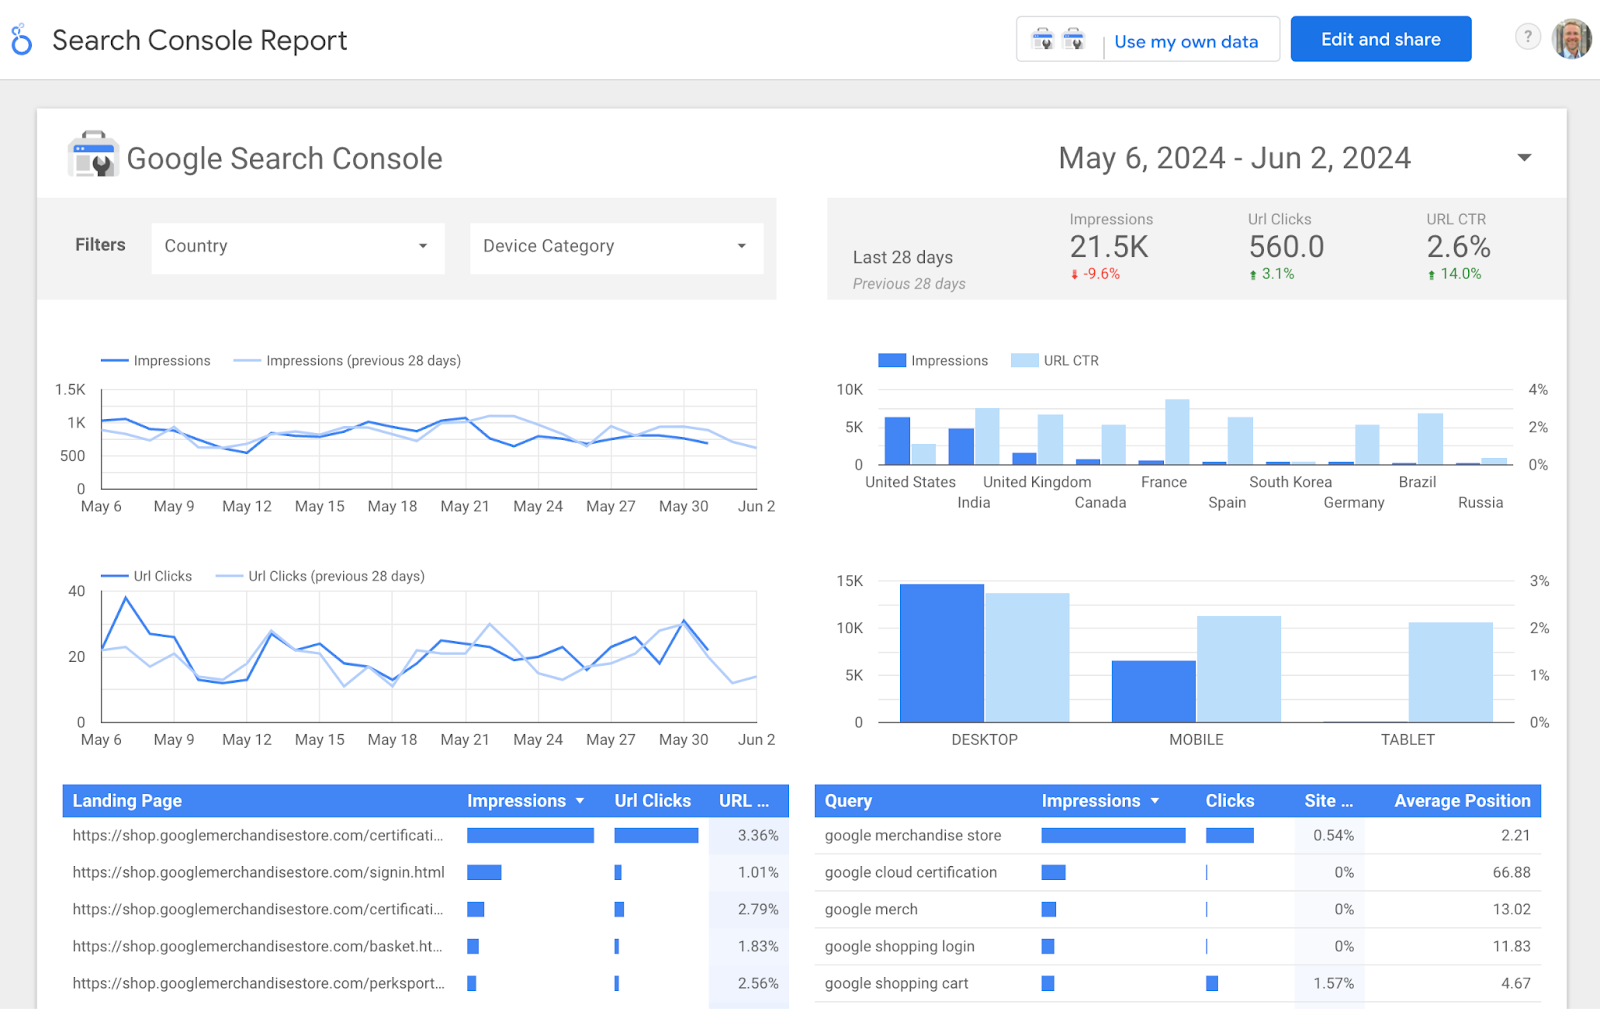
You can also link the GSC datasource to build easy dashboards in Google Looker Studio. In fact, there is a Search Console example dashboard you can use and just connect to your own data source.
Discovery phase
At this stage of her journey, Annie is still an unknown visitor. She is however active on our website, browsing pages, interacting with the functionality, and so forth. Total visitor count is a key metric to understand the total volume of our potential customers. Against this total count, we can work out overall site visitor conversion rate.
We may want to determine a number of conversion points relative to stages of our funnel e.g. visit > contact conversion rate, visit > purchase conversion rate etc. Whilst high-level, tracking these metrics over time will give us a broad indication of the overall effectiveness of the digital experience we are providing.
Engagement metrics are critical in gauging the effectiveness of our website in providing the kind of experiences that our visitors expect. Metrics such as time on site, return visitor %, pages viewed, and any significant event actions (e.g. watching video, download documents, view content) can all be indicators of engagement.
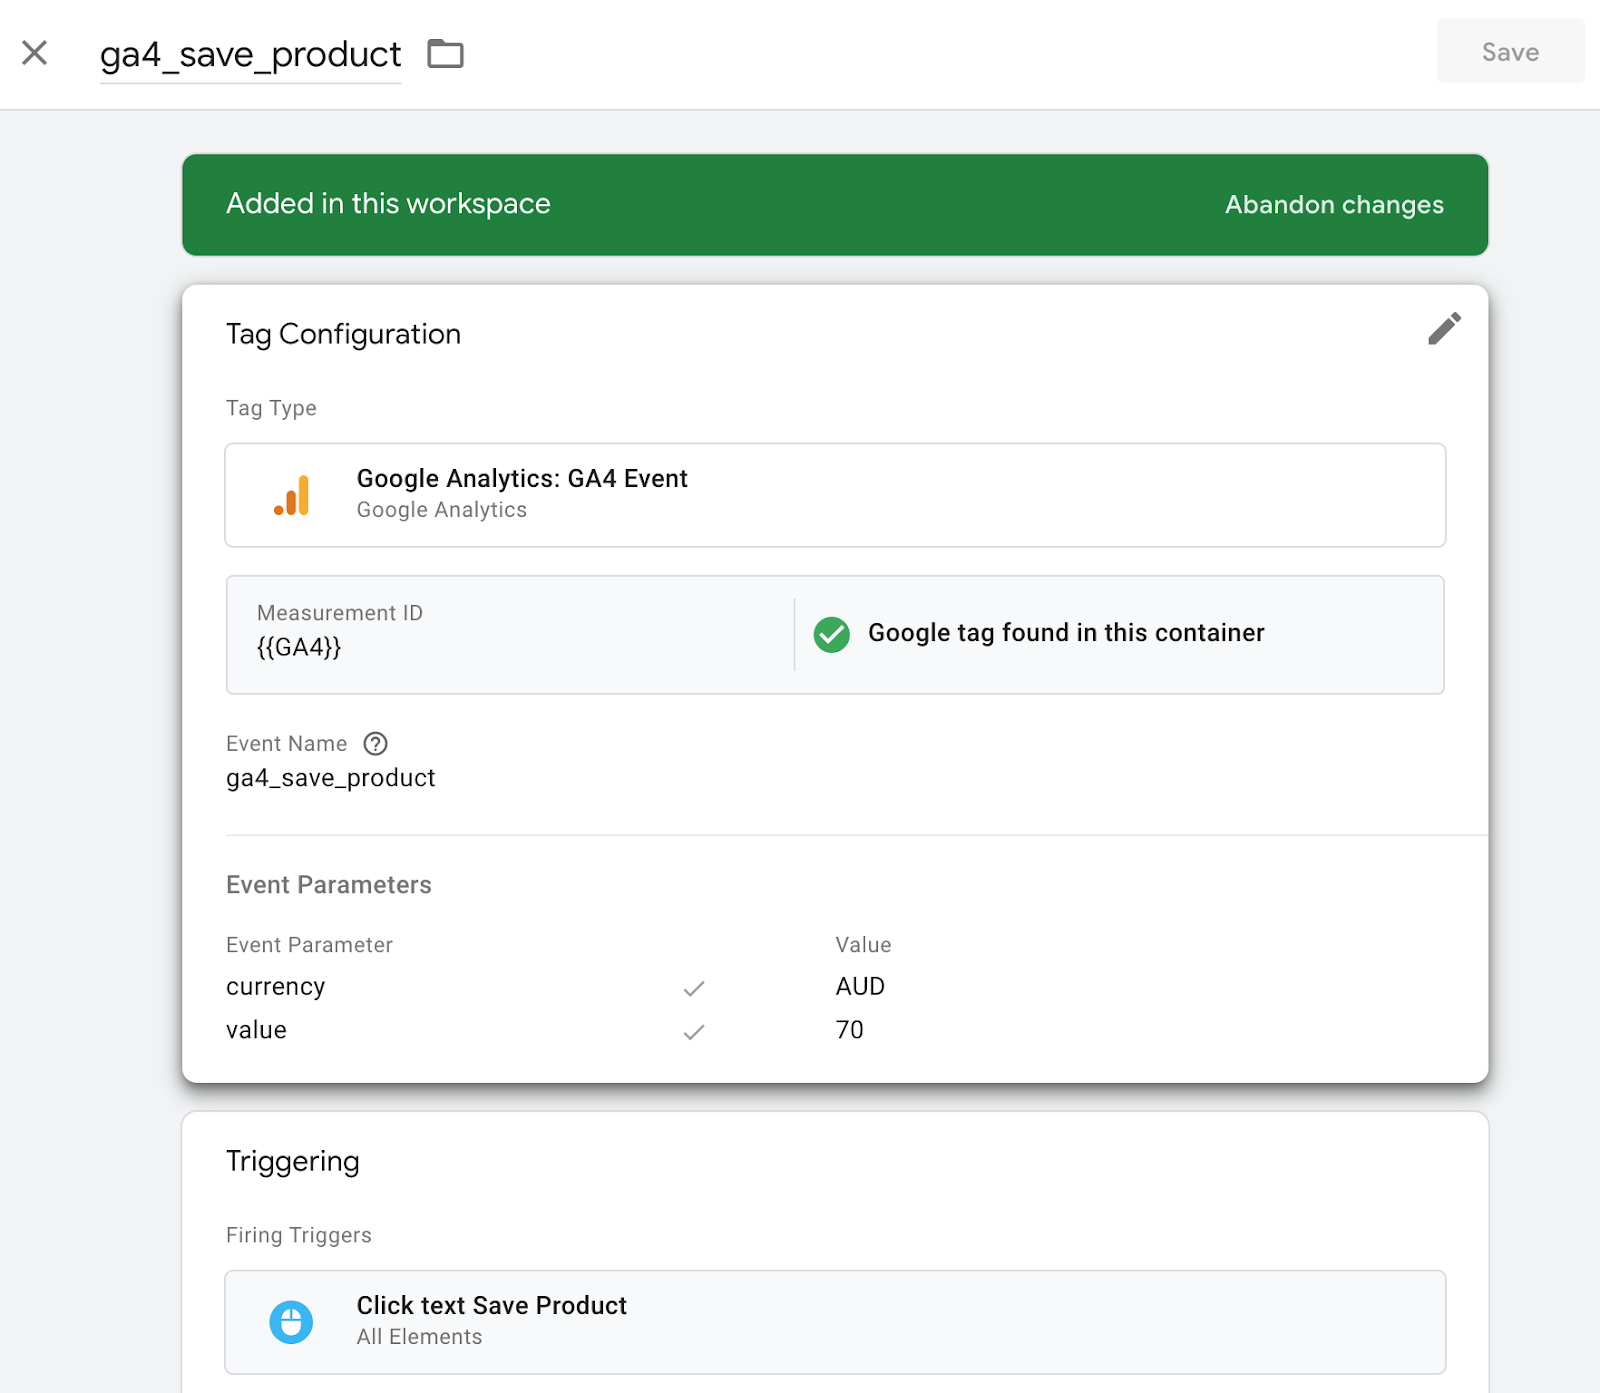
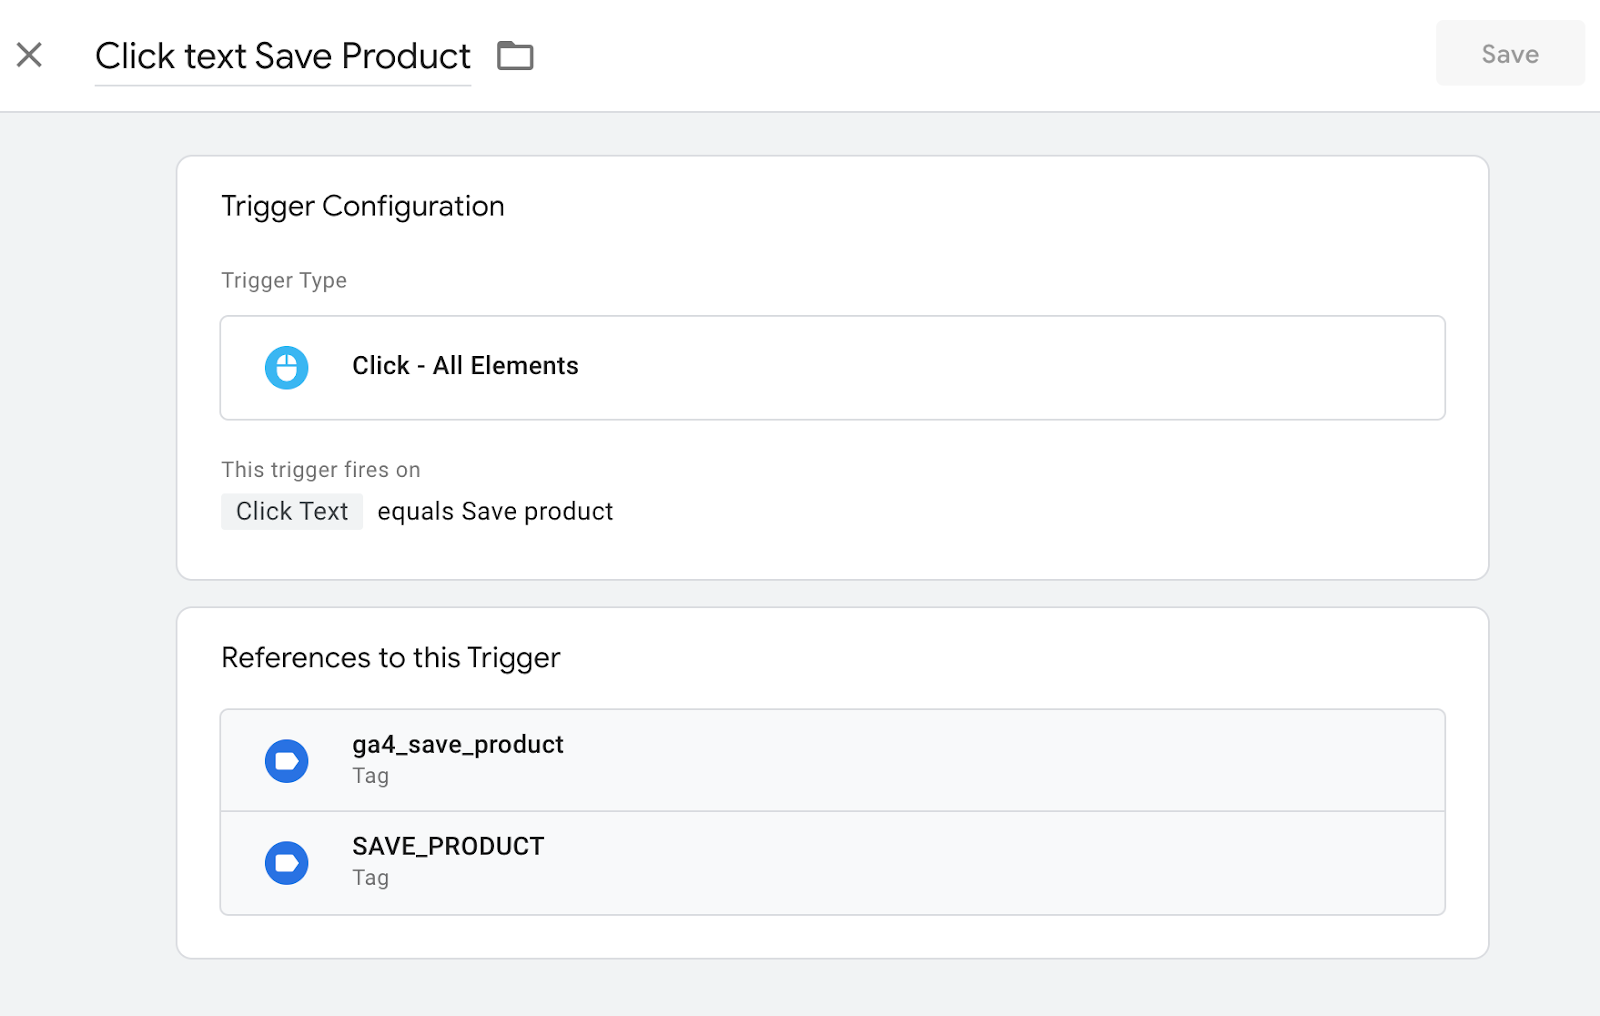
Many of these metrics come out-of-the-box with Google Analytics (GA). Google Tag Manager allows you to track a wide range of user behaviours and attributes on your site. By combining custom event tags with targeted triggers, any type of user behaviour on our website can be captured as used as a key metric e.g. button clicks, referring URL, destination pages, scroll depth etc.
I recommend undertaking a strategic process to develop an Engagement Value Scale to guide the design and configuration of custom events and goal tracking. You can read more about that in this blog post on building an Optimisation strategy.
Of course most CMS solutions, like Sitecore XM Cloud, come with basic analytics built in. Whilst the built in analytics currently lacks the ability to customise, like GA, further enhancements and additions are likely as the SaaS solution continues to receive regular updates. In addition, providing basic entry-level analytics makes sense when you consider that most website administrators and content authors do not typically have the expertise or time to spend on learning complicated analytics products, let alone further configuring them to bespoke needs.
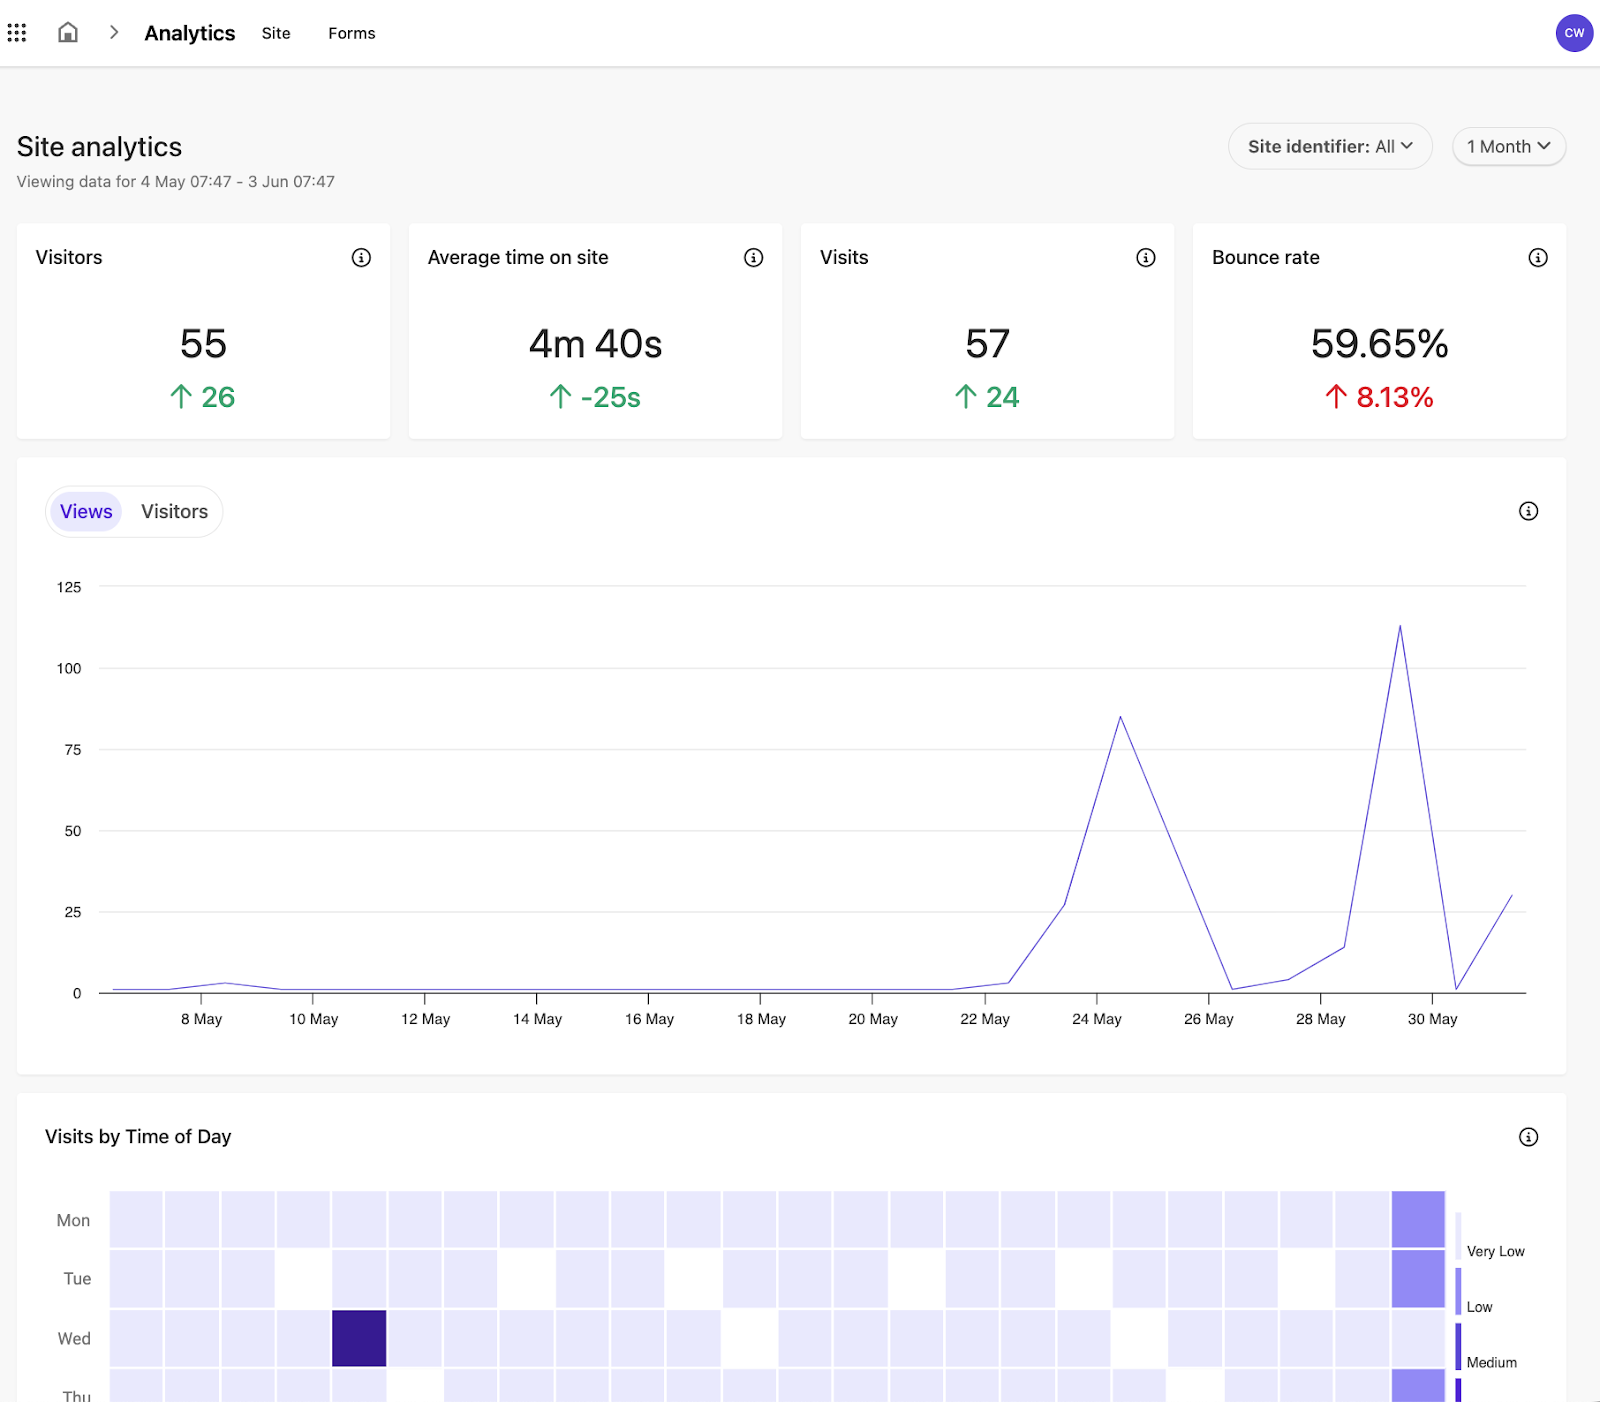
Note that Sitecore XM Cloud Analytics is limited to 1 month worth of data, with the previous month used as reference to show metric change. As you can see, the analytics available are basic but fundamental in understanding total visitors and basic engagement.
Even as Annie remains an unknown visitor, with a Customer Data Platform (CDP), like Sitecore CDP, in place and connected to your site, you are accumulating data about her, regarding her content interests and behaviours on the website. You may also capture characteristics about her visit including geolocation, browser and device type, and so forth. This anonymous profile data holds substantial value, even at this stage, as it can be used for general website personalisation (customisation). And later, upon converting Annie into a known contact, all this data will be combined with her known identity, furnishing a richer and more comprehensive lifecycle view of Annie from first point of contact through to purchase and beyond.
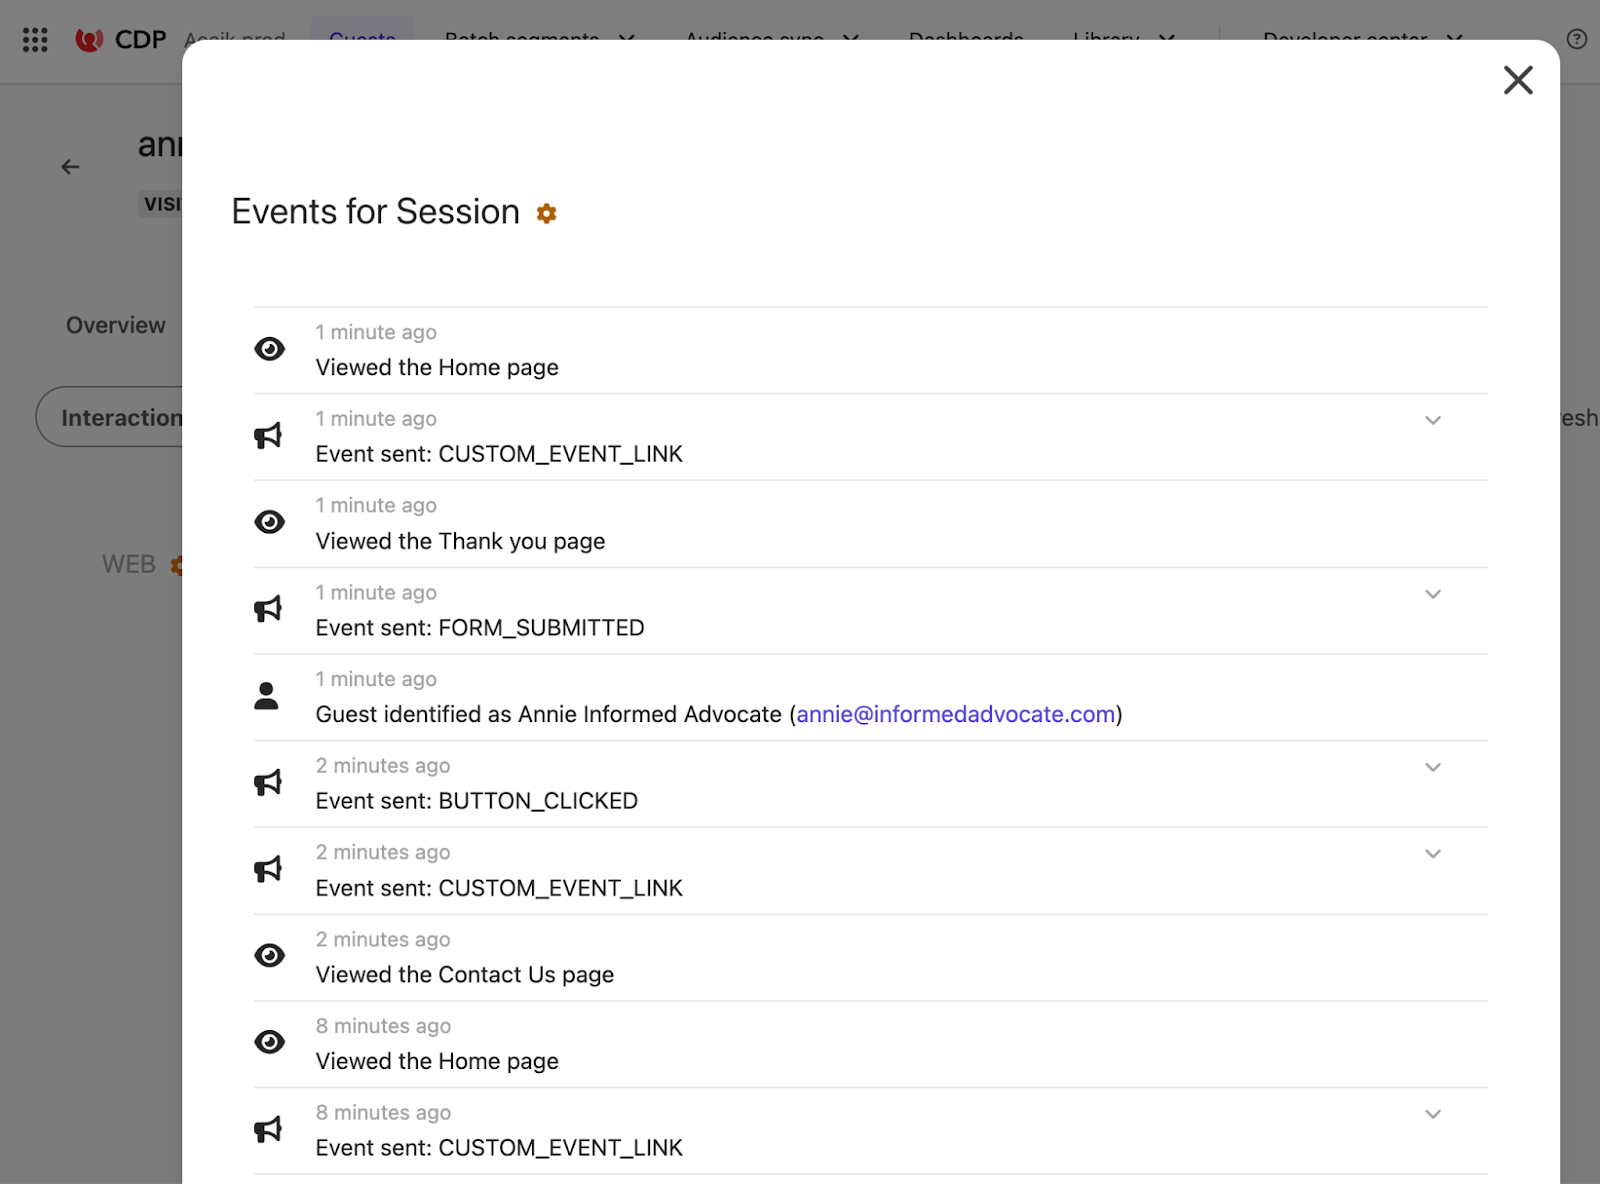
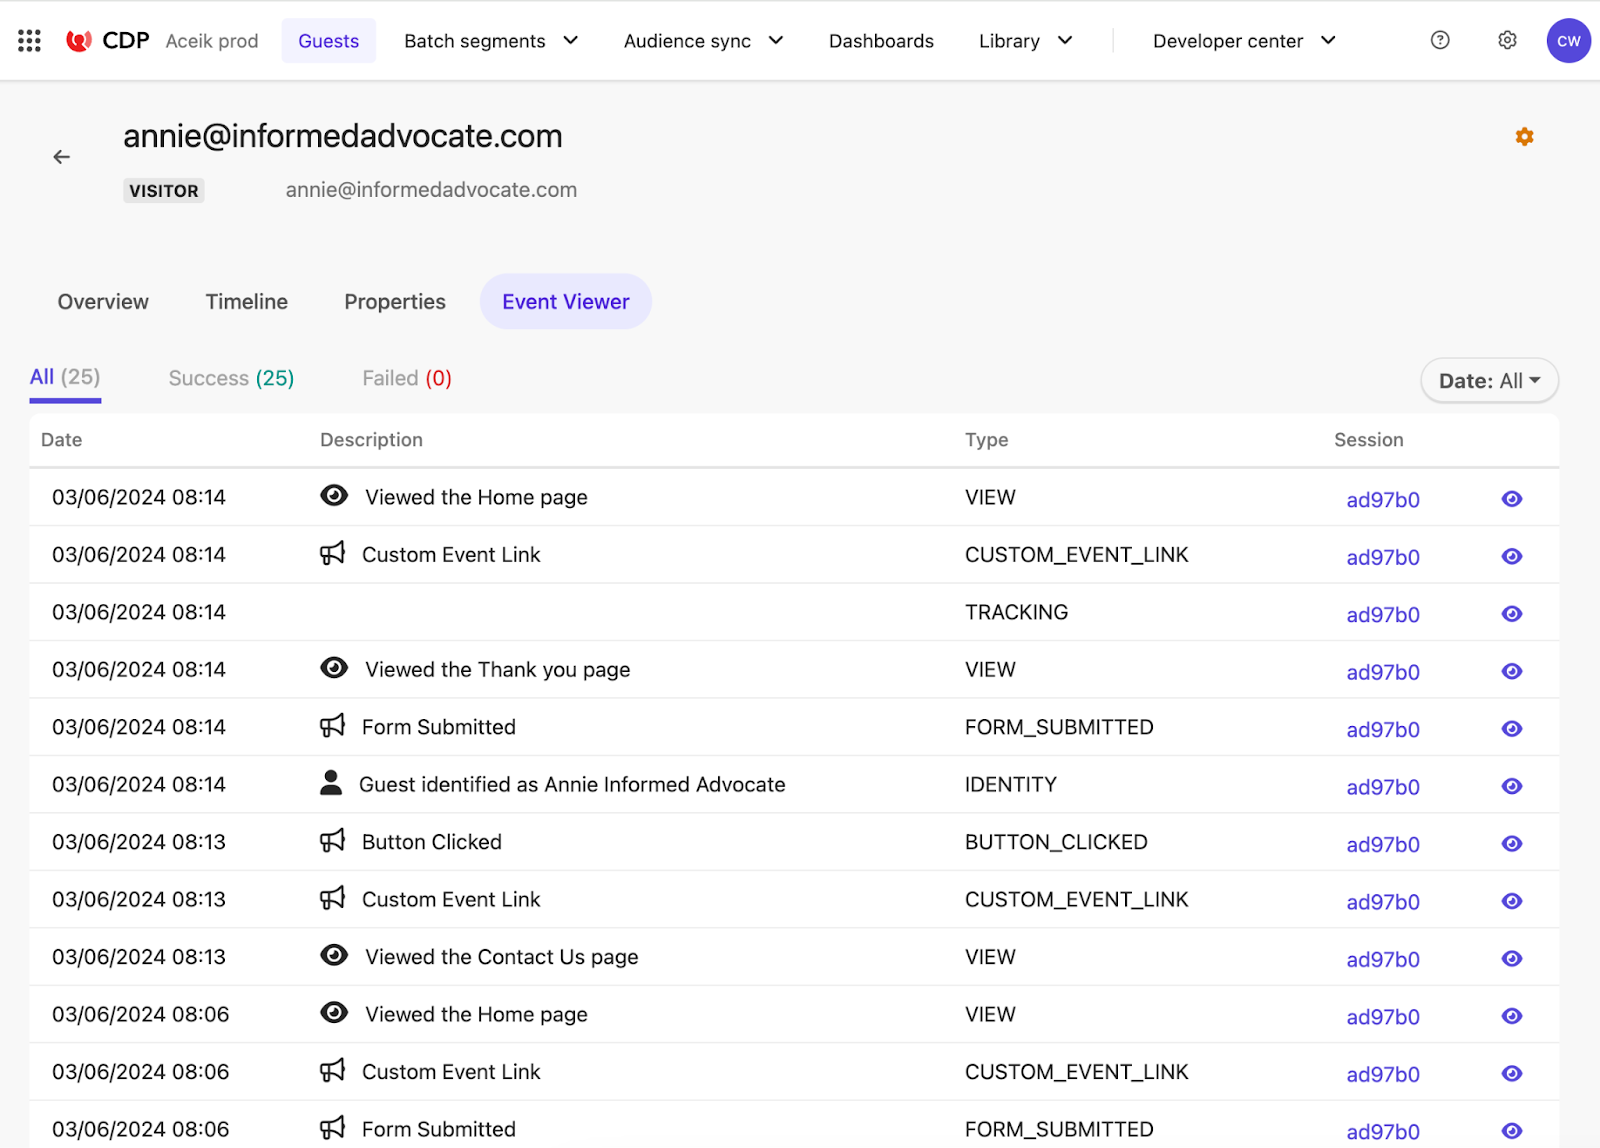
On our demo site, visitors identify themselves using our contact forms. In Sitecore CDP we can see how this converts our guests from Visitors to Customers. You can see in this Timeline and Event Viewer views, that Annie visited the site, completed various actions, and then completed a form which triggered an Identity event.
Sitecore CDP is a rich source of data regarding our customer interactions with our website. As mentioned, the default homepage of CDP is actually a web analytics dashboard with basic visitor and engagement metrics. However, far beyond this, CDP captures all sorts of data about your visitor behaviour and attributes. This can be a combination of ‘out of the box’ data attributes but also custom data based on your configuration of events and data models that you send to CDP via its stream, batch and interactive APIs. It is worth noting that as a business, we are in control of the data we capture, including whether or not to include Personally Identifiable Information (PII).
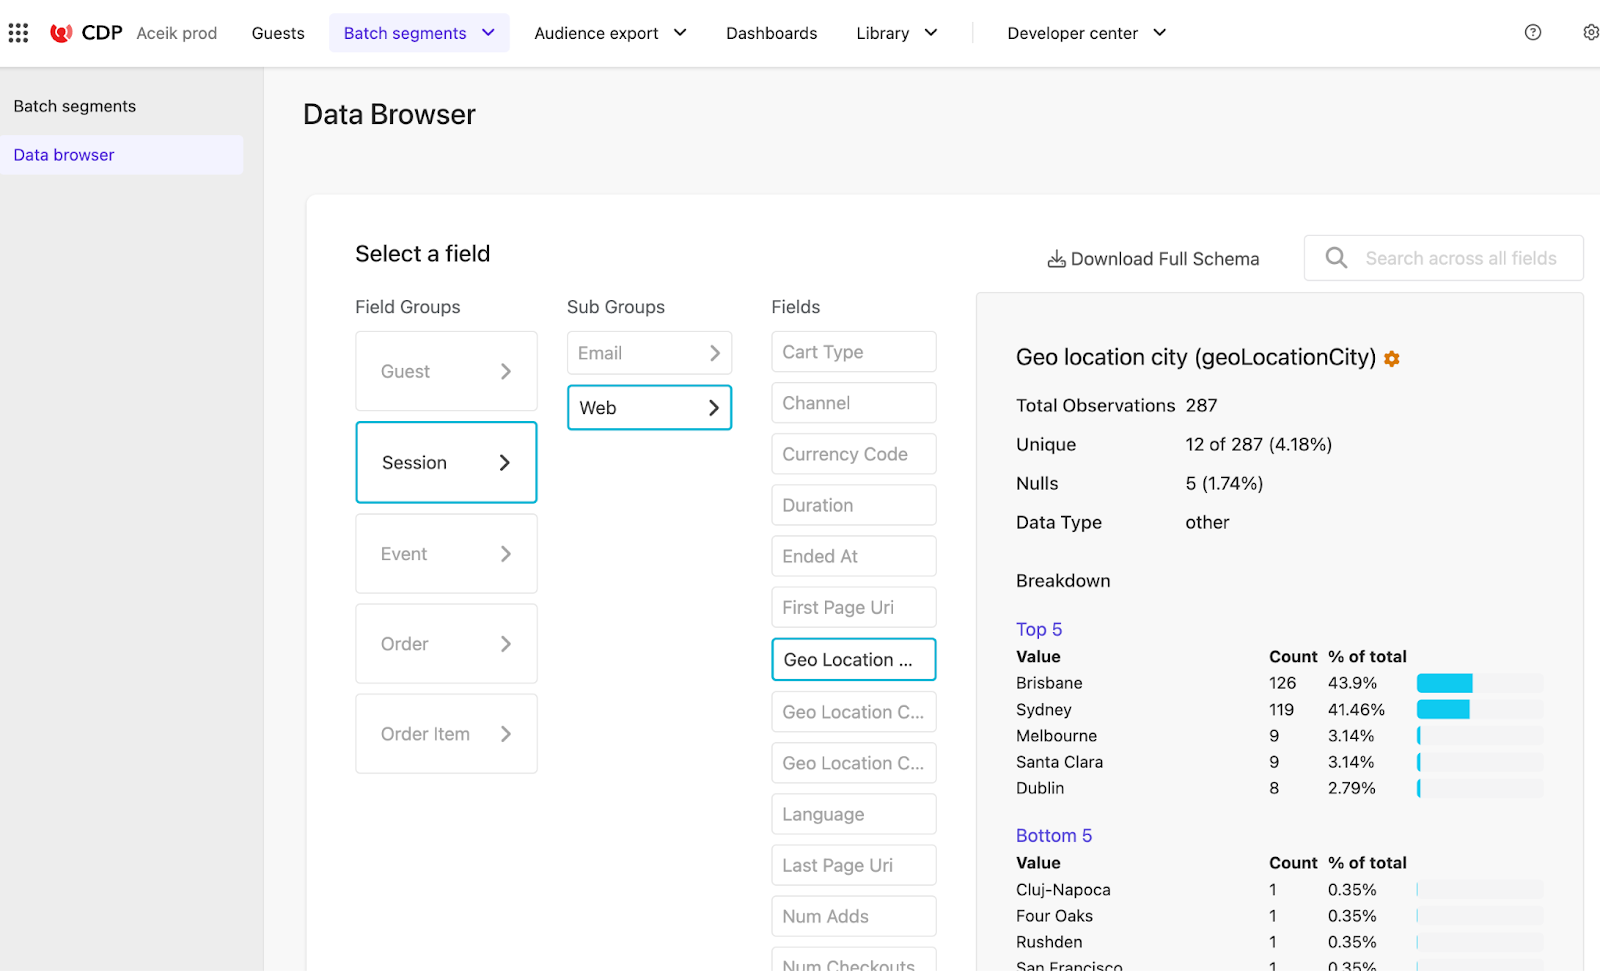
The main mechanism for exploring data captured is the CDP Data browser. As you can see below, we can explore all sorts of data attributes for our visitors, such as their geolocation. Let’s assume Annie was based in Sydney, so she is included in the dataset below.
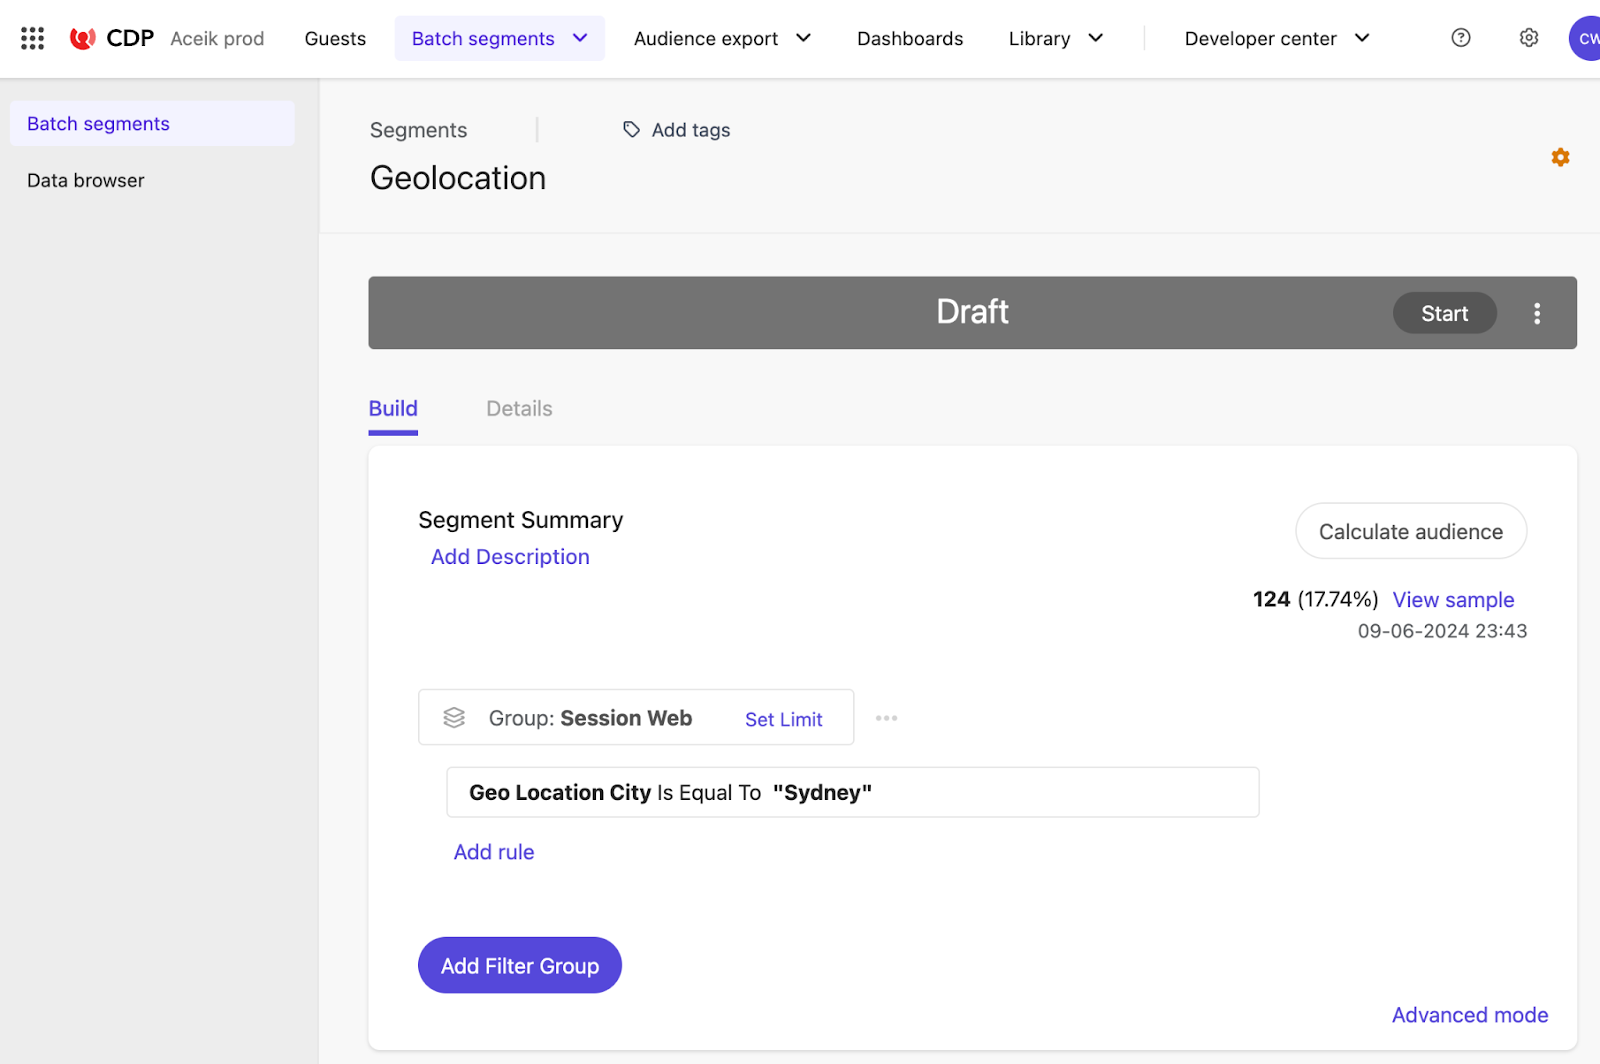
Once we have a good understanding of the data captured, Sitecore CDPs Segment builder is how we build our audience groups to then target for further optimisation or sharing across other digital channels or platforms. So we created our Segment to identify only visitors from Sydney.
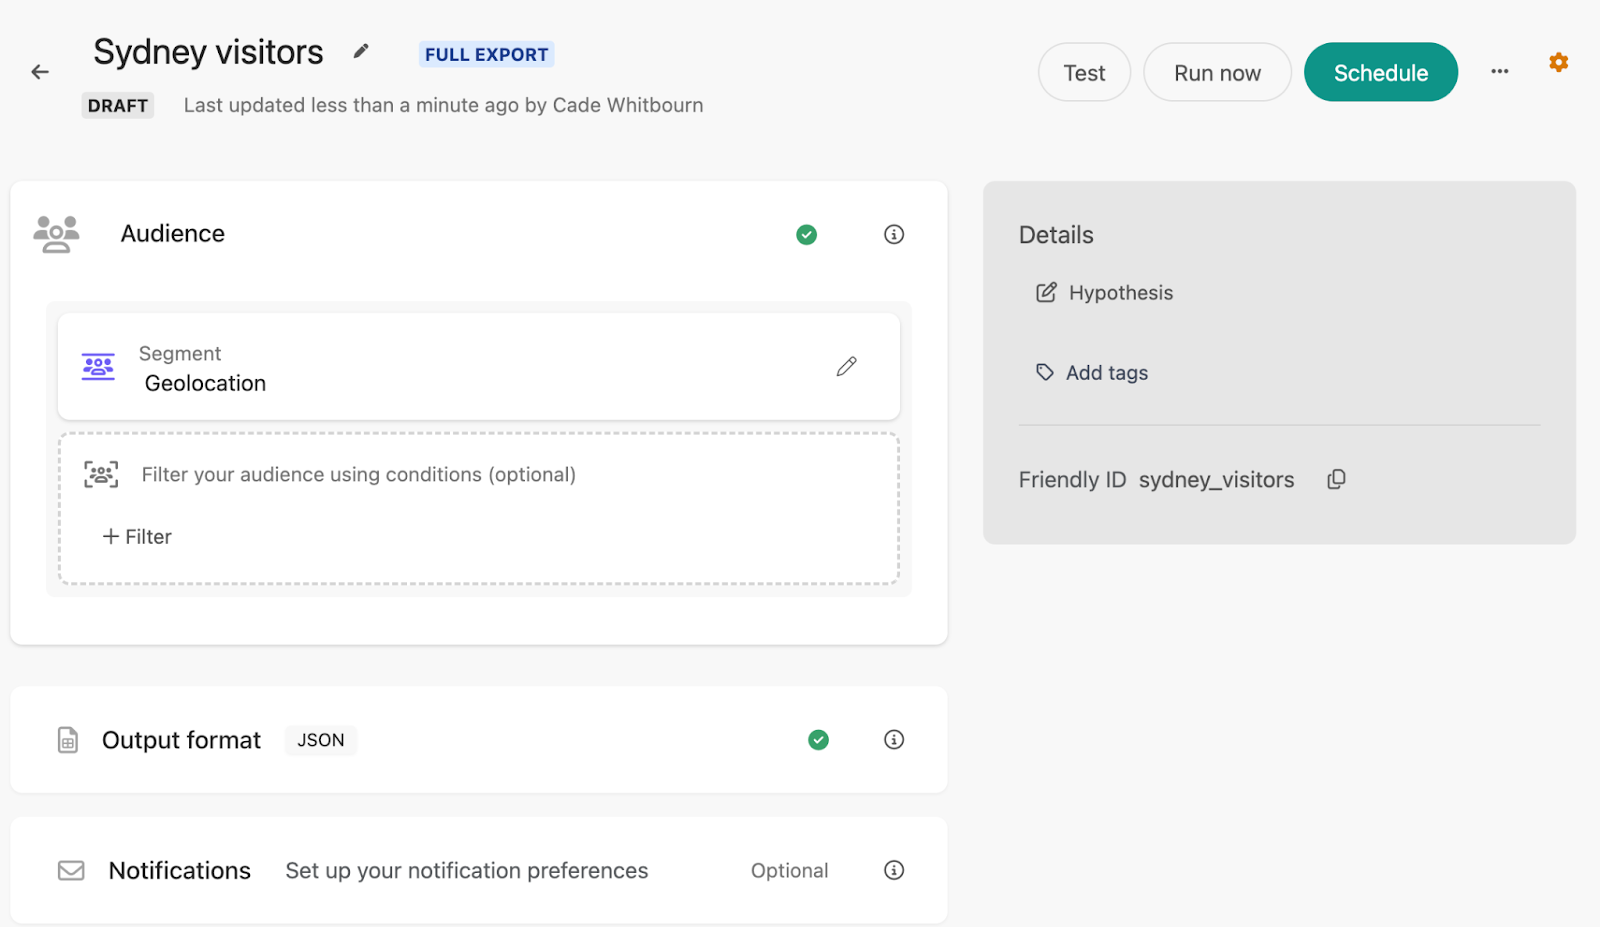
The next step is to create an Audience export where we can make our JSON feed of Sydney visitors available to any external channel/platform, such as CRM or digital advertising platform for activation outside of the CDP. With this, we can target Annie outside of our website channel as she continues her daily activities across the web.
Consideration phase
As Annie’s journey continues, she moves into the Consideration phase as she starts to look specifically at the details of Insurance options she may wish to purchase. Annie’s aim is to build her knowledge, and therefore her confidence in her future decision-making. The role of our website therefore is to intuitively guide her through the process of consideration, with a focus on getting her to share further attributes, characteristics and interests, so that we can progressively enhance our profile of her. To do this, we want her to further engage with us through different contact and identification activities on our website.
Key metrics here are unknown visitor to contact conversion rate, and the total volume of contacts captured through our digital channels. These may be simple enquiry forms, live chats, email sign-ups, or newsletter subscriptions, among others. Tracking conversion rates for each, as well as total conversion rates and total conversions, is critical to understanding the effectiveness of the Consideration experience on your website.
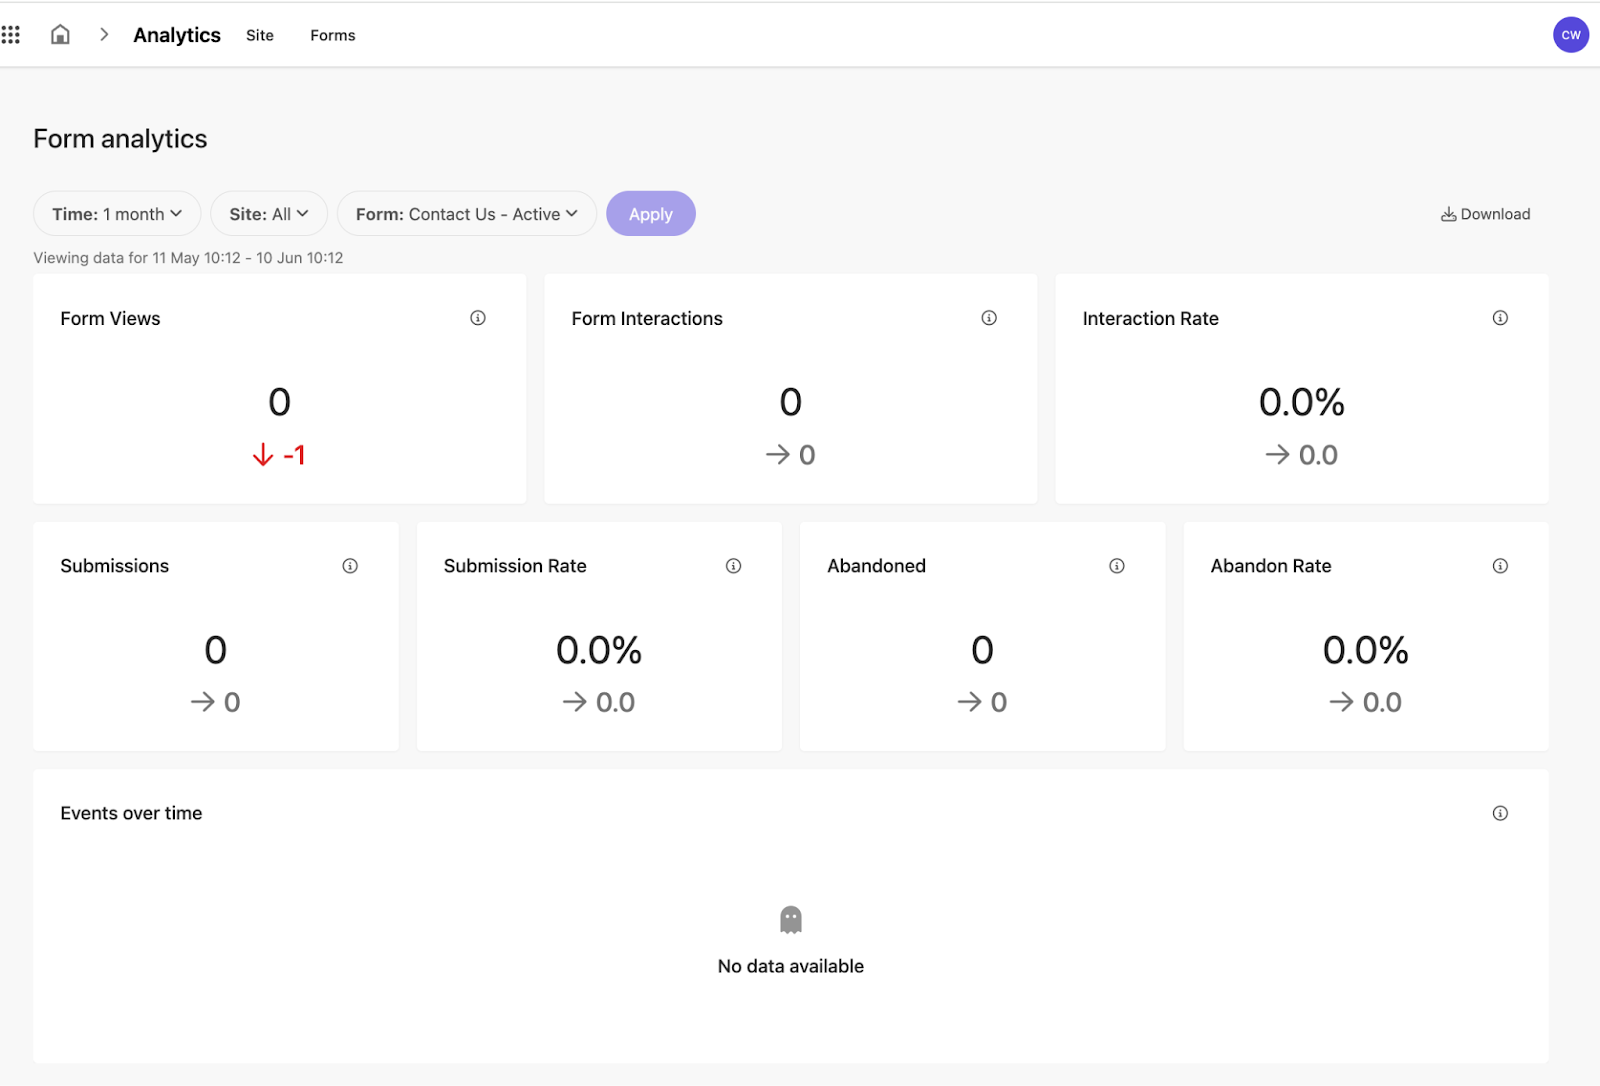
If you are using XM Cloud as your digital experience content management system, the new Forms application provides built in analytics. Metrics include Views, Interactions, Submissions and Interactions. Even better, each of the metrics come as a Rate as well i.e. %. I’m really excited about this ‘out of the box’ reporting capability as it covers all the key bases for form analytics. However unfortunately, as at the time of this writing, there appears to be a bug with the Interaction Rate where it does not display accurately. I expect this will be fixed soon.
Given we have already captured Annie’s contact information, at this stage of the journey we can continue nurturing her towards purchase using email communications. Key metrics for email marketing, beyond sign-up rates, include opens/open rates, click-through/CTR, and unsubscribes/unsubscribe rates.
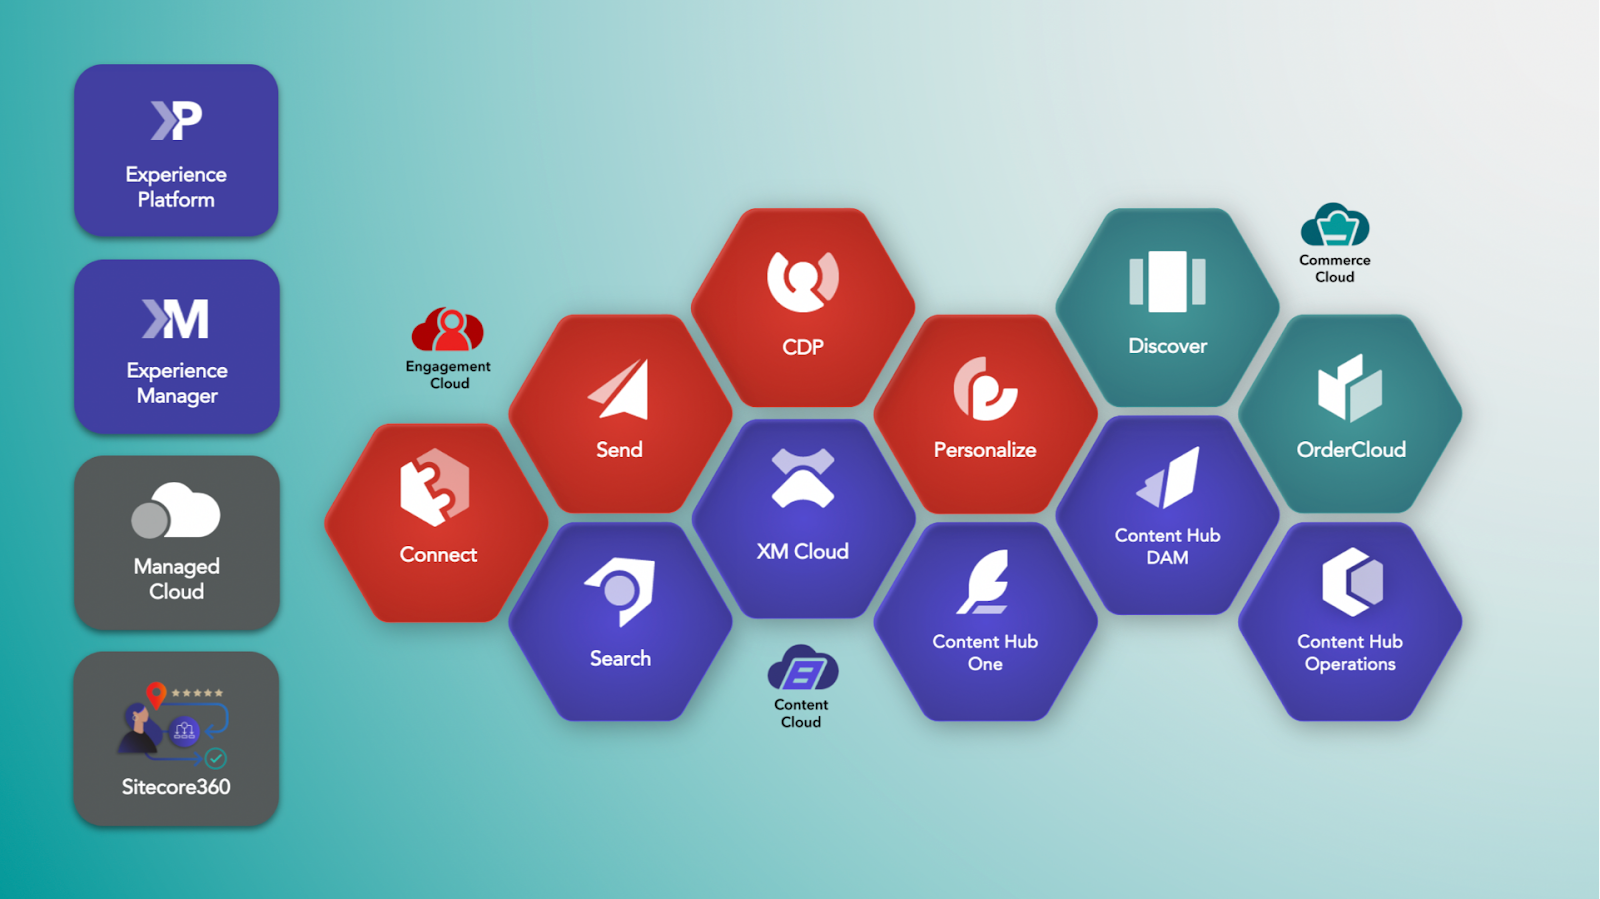
Sitecore Send is another part of Sitecore’s engagement cloud, and is a great tool for this kind of job. According to the documentation, ‘Sitecore Send is a cloud-based, AI-powered email marketing solution that lets you target your audience at scale.’ From my own experience, it is an easy to use yet powerful platform which you can quickly onboard and build out email marketing and automation campaigns to nurture prospects.
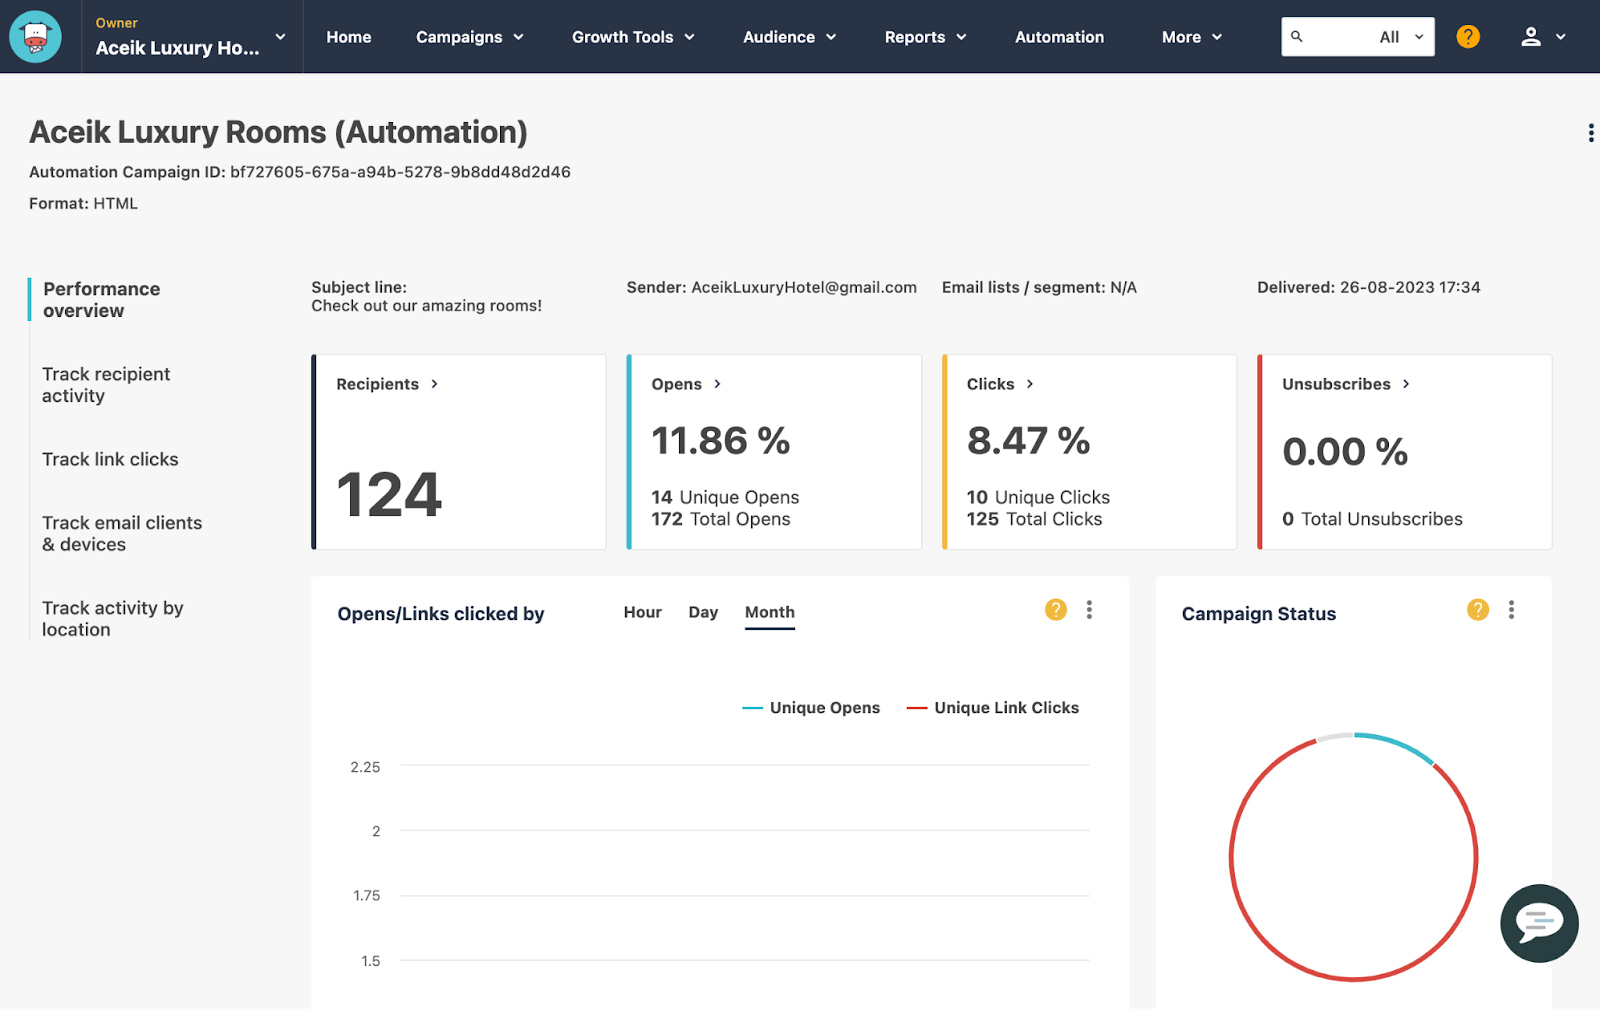
Sitecore Send comes with all of our key email metrics available out of the box in an easy to read dashboard.
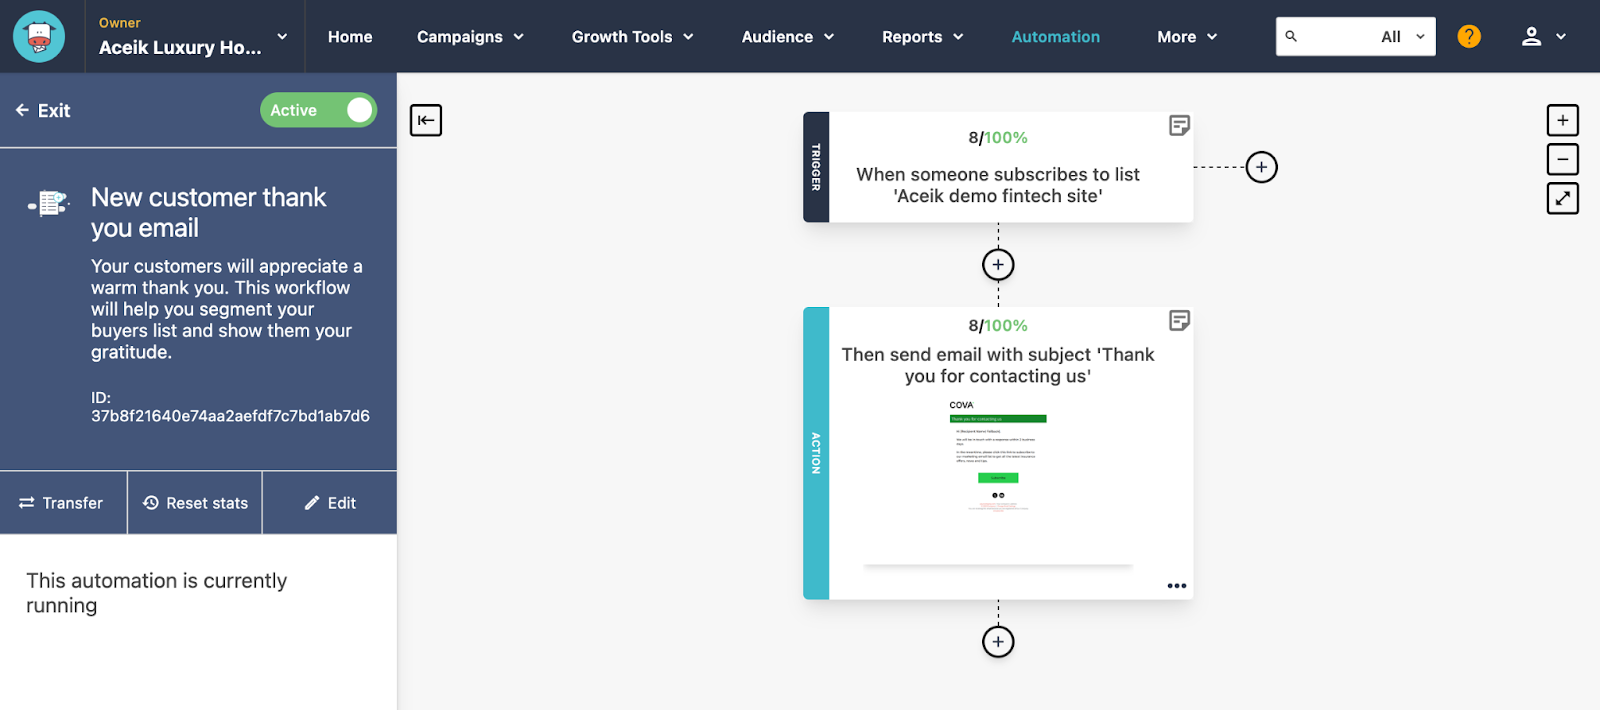
Automations are easy to build using the drag and drop editor. In our example, we want to ensure that Annie receives prompt (automatic) follow up emails to her enquiry, to provide her a high degree of reassurance that her questions will be answered.
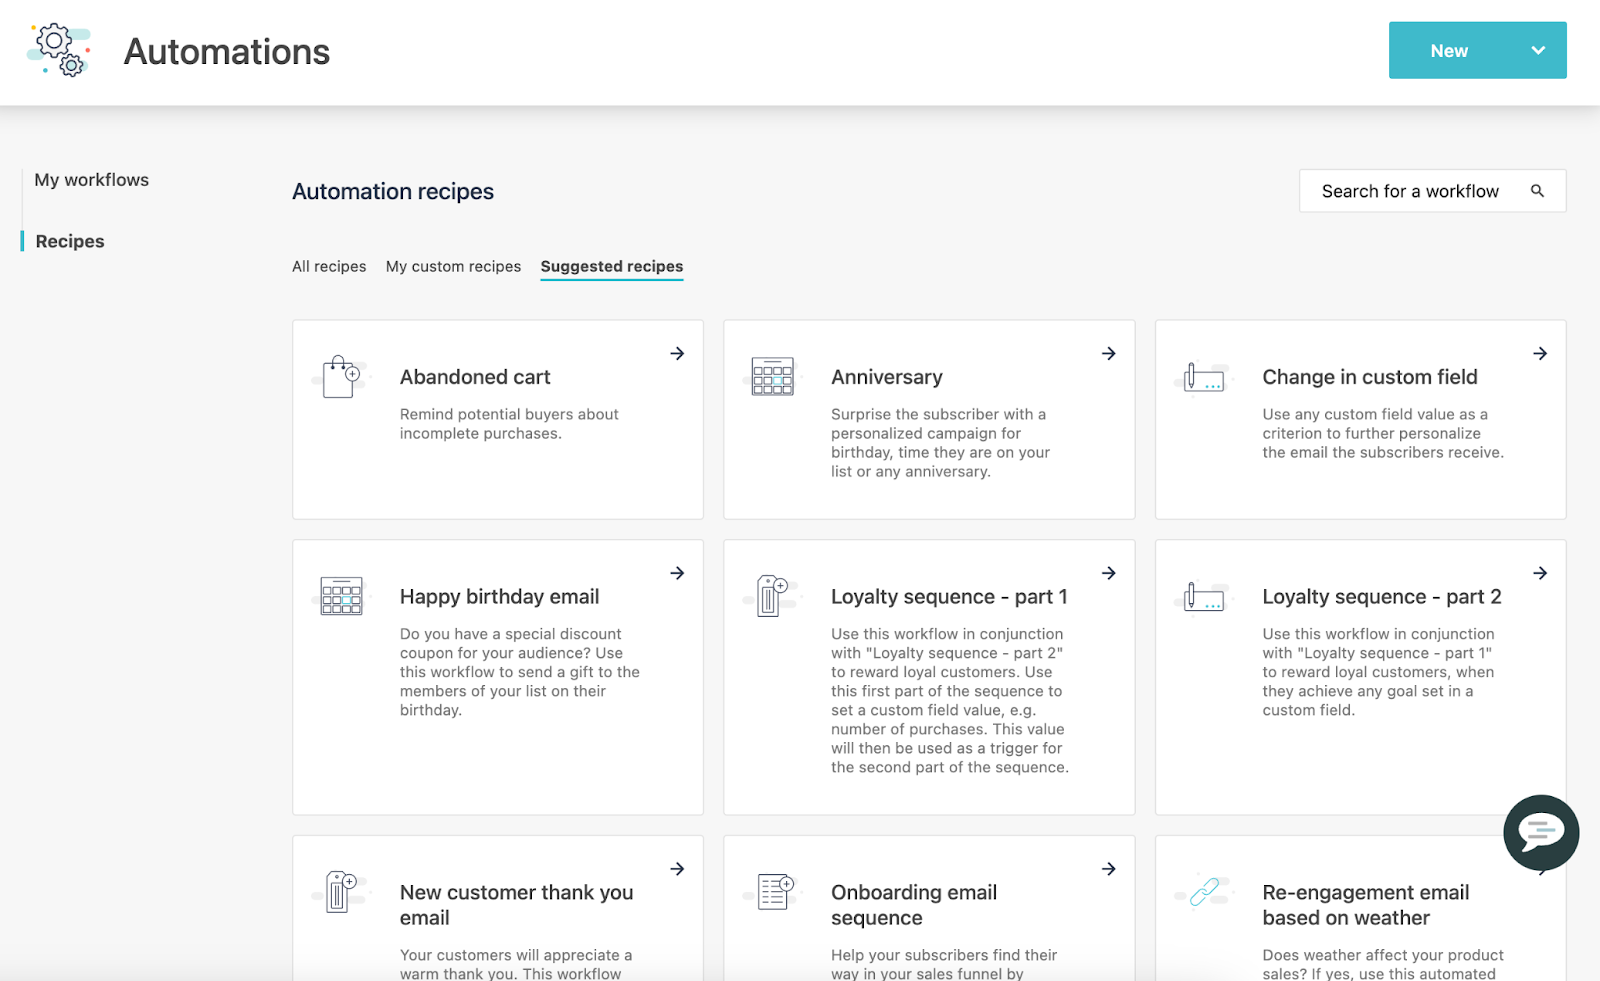
I really like Sitecore Send’s ‘Recipe’ feature that lets you quickly build automations based on pre-configured steps, triggers and actions. As you can see below, a lot of common use cases are covered.
With email now in play, Annie moves towards the Decision phase of her journey…
Decision phase
During this phase Annie is honing in on specific Insurance product preferences and undertaking actions tailored to those preferences. In our scenario, this may involve shortlisting, downloading product information and, ideally, requesting a product quote.
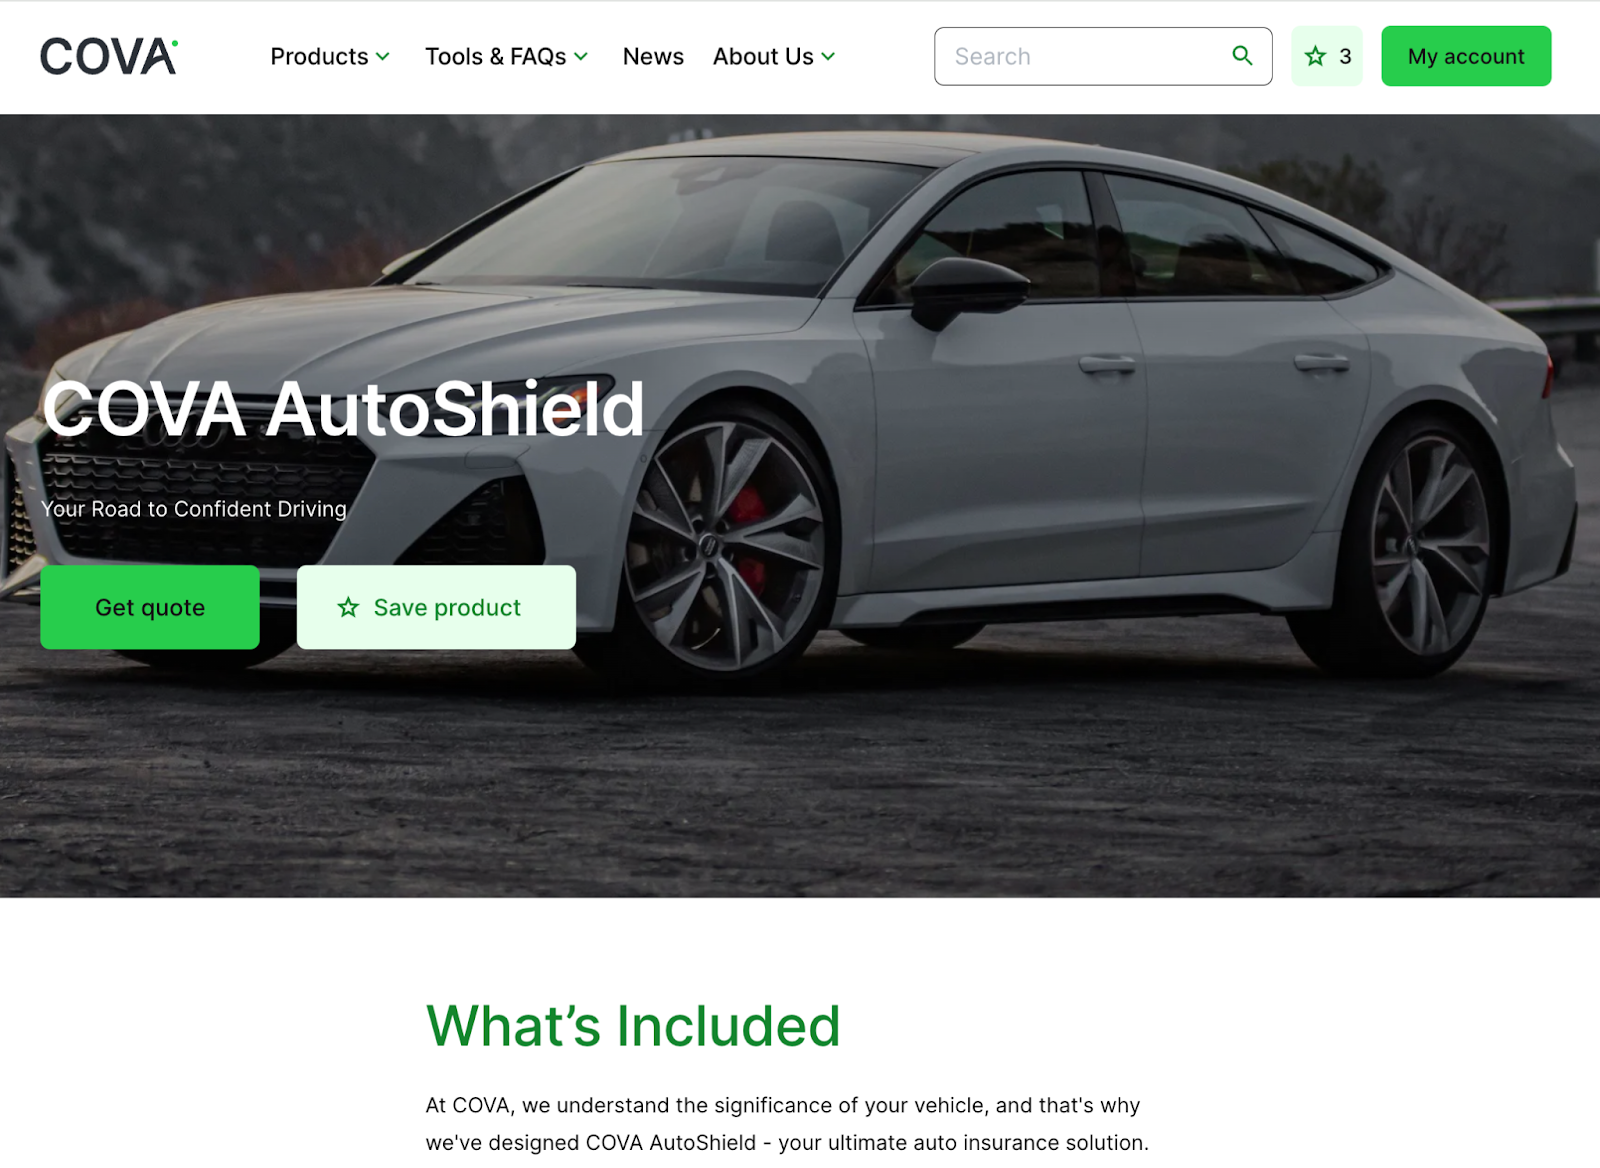
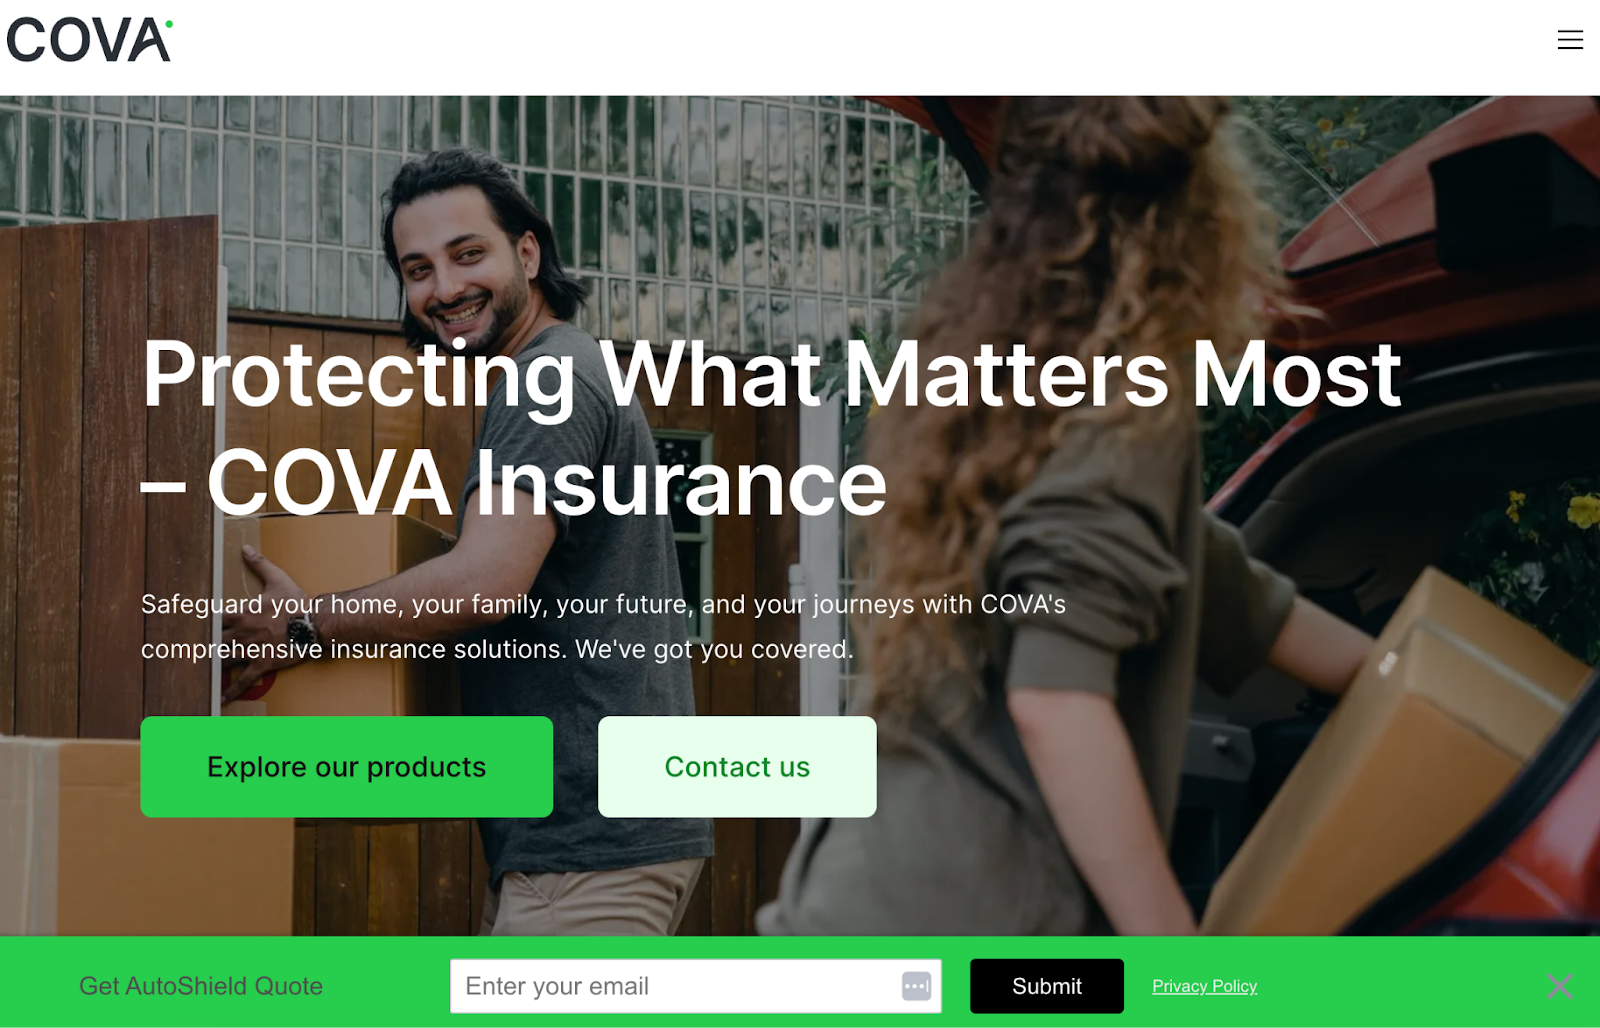
As we are now catering to a known visitor, personalisation can be specifically targeted to Annie across all channels, potentially down to displaying the precise next step we most want Annie to take after every key action she takes on your website.
Tactics could include prompts to return to the product page viewed on previous visit, pop-ups on other pages to drive product information factsheet downloads, and time-sensitive discounts or other incentives to request a quote today.
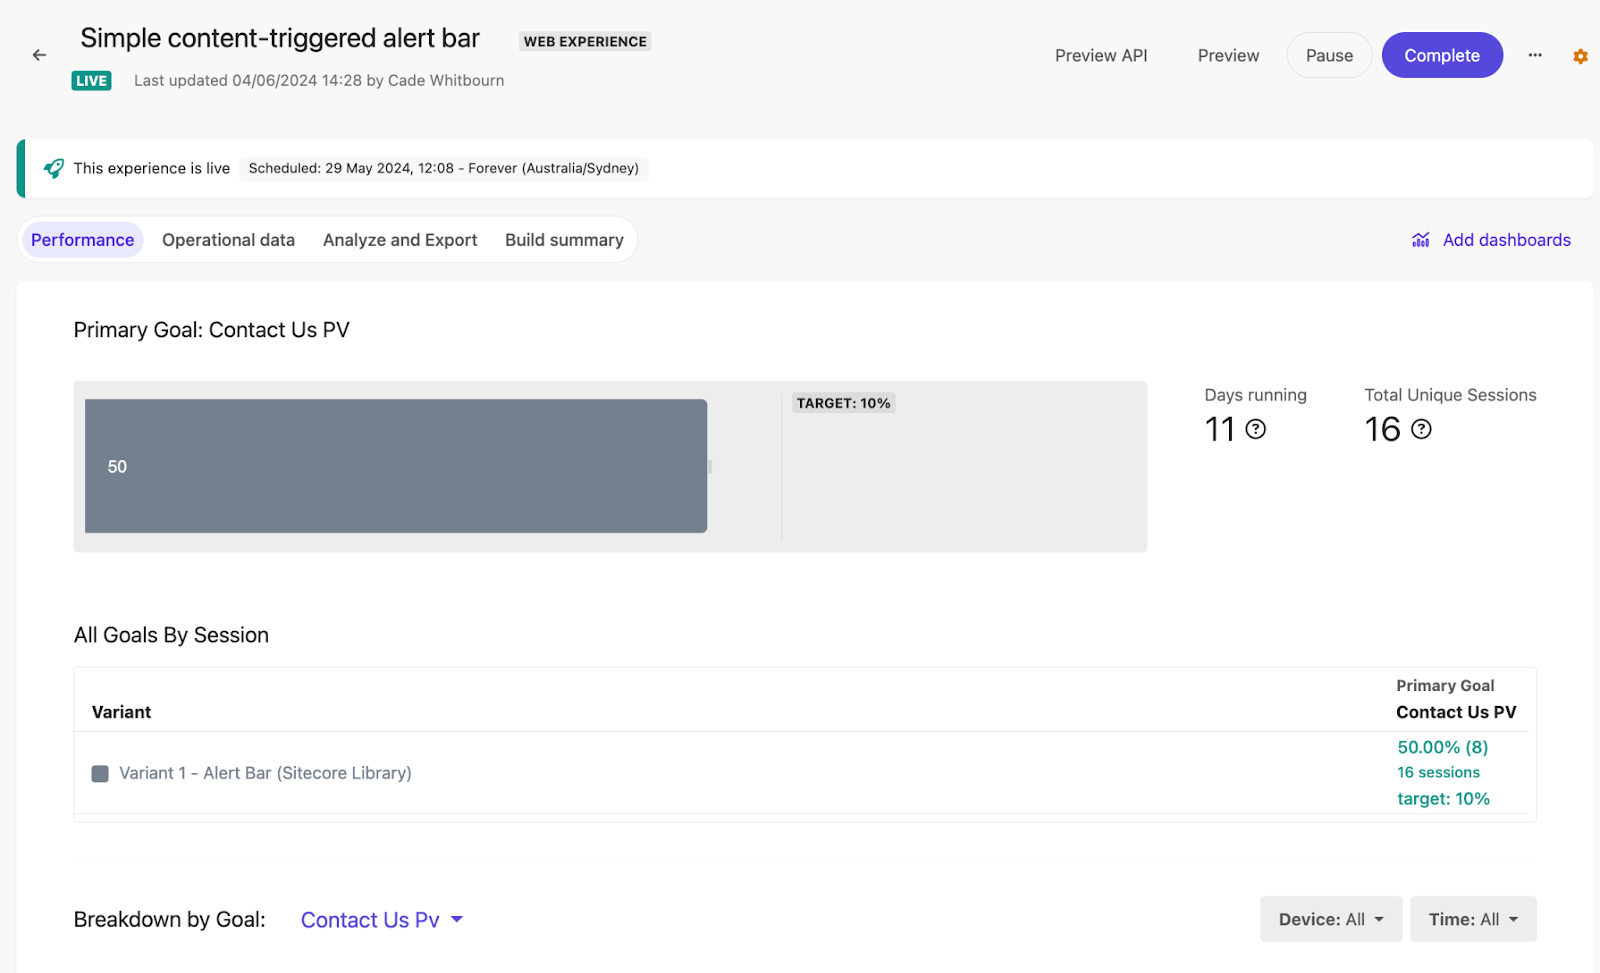
Key metrics to monitor here are specific product page views, product information downloads, and the conversion rate of quote requests. Furthermore, engagement metrics and personalisation performance metrics are also crucial here, as you can use these to demonstrate a positive ROI for the additional investment made in digital optimization. For example, if the implementation of personalisation tactics delivers a 5% uplift in purchase conversion rate, then you can use your average purchase value and total purchases to calculate the return from the implementation of these tactics against the cost of purchasing and operating the personalisation capability. Hopefully you can determine that personalisation pays for itself!
Sitecore Personalize comes with a whole range of analytics and reporting dashboards available out of the box. You can review the list here. Again, whilst limited in the ability to customise, this range of dashboards gives you a pretty comprehensive suite of ways to analyse and draw insights from your optimisation activities. This list of dashboards will also likely grow and improve over time through regular SaaS product updates.
Purchase phase
At this stage of Annie’s journey, we are primarily concerned with metrics regarding the Insurance product purchase event. Ensuring a seamless uninterrupted experience is paramount, thus tracking metrics concerning failed conversions due to incompleteness or errors is important.
Google Analytics, and its ability to configure and track all kinds of user events will be useful here as you may need to configure different types of event tracking throughout what is often a multi-stage purchase funnel.
Using some advanced reporting features of Google Looker Studio, you can model a purchase funnel showing the drop out rates at each stage. This type of view is helpful to align internal stakeholders with the specific parts of the process that need the most targeted attention i.e. investment.
Here’s a write-up of some good ways to build visualisations in Google Looker Studio – https://blog.coupler.io/looker-studio-funnel-visualization/. The following is a Community Visualisation I’ve used with good effect for building funnels – https://blog.coupler.io/looker-studio-funnel-visualization/
Continuing to monitor the performance of personalisation remains crucial in this phase as well, as a well considered marketing automation strategy will be deploying various types of tactics to nudge users such as Annie over the line to complete the purchase action. This may be, for example, incentivising through targeted time-sensitive discounts, presenting tailored products based on her interests, or just personalising the experience overall so that she feels as though she is receiving an individualised service.
Email metrics may also continue to be relevant here, especially if email is employed in the final conversion funnel processes or if there are click-throughs from confirmation emails.
Reporting
Whilst we have discussed various places and methods of looking at analytics across the user journey, I will now suggest a few key principles of data analytics and reporting.
Firstly, it may be impractical and cost-prohibitive to try and build a master data repository and reporting solution for all your digital analytics. Whilst it can be done, this type of approach suits organisations with high levels of digital data maturity, and generally organisations that have standardised their systems to a common suite of applications that play nicely together.
In many cases, and for most organisations, initial steps towards greater digital analytics maturity can be realised with simple spreadsheets manually updated. Retaining manual steps helps to enforce some discipline regarding focussing on key digital metrics, and not just everything you can possibly think of.
Here’s an example of the kind of spreadsheet-based KPI dashboard we may wish to develop.
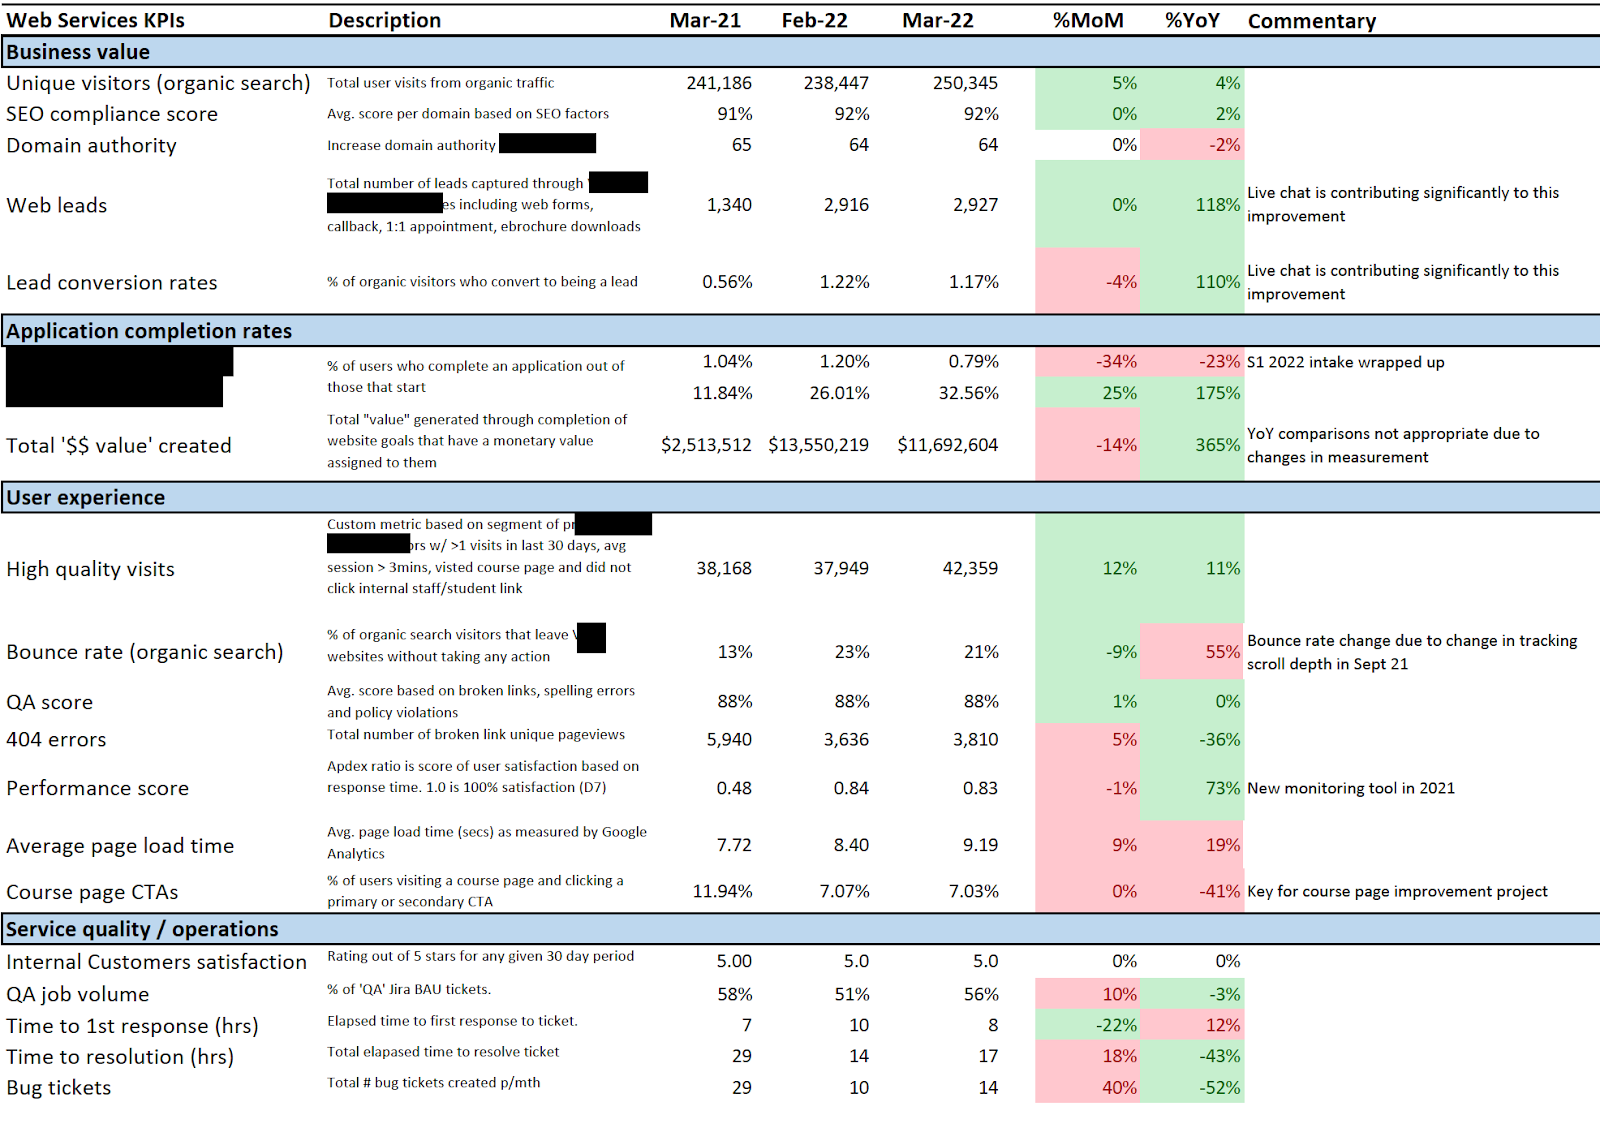
When it comes to reporting and tracking key digital metrics, you should consider metrics from a number of perspectives:
- Compare to previous month (MoM): for immediate insight into relative performance
- Compare to same time last year (YoY): This will help you account for seasonality and annual trends in your data
- Compare to a benchmark: The simplest way to create a benchmark is an average over the last 12 months
- Compare to target: This is a number you determine in advance, based on last years benchmark. For example, your target may be a 5% increase this year.
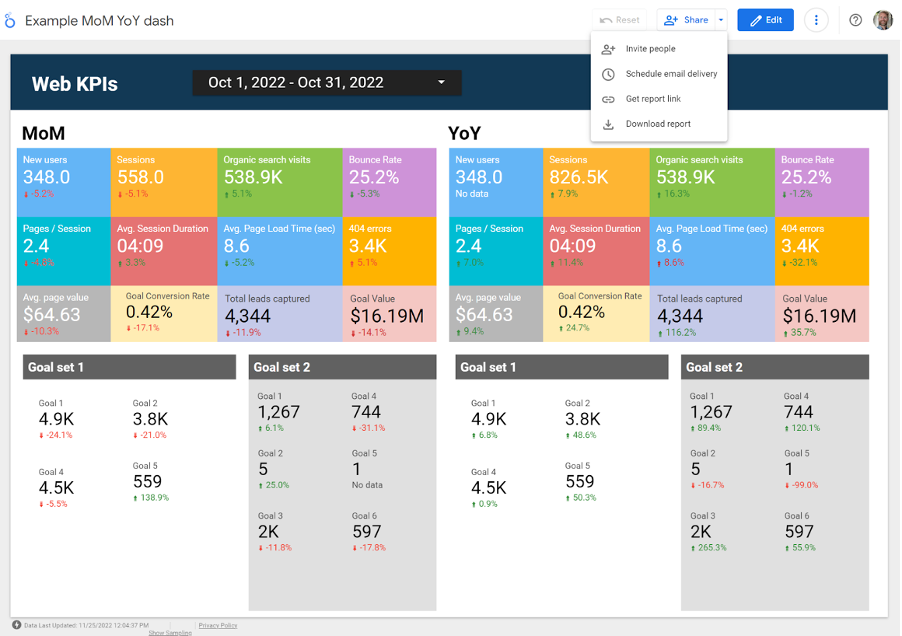
Here is an example of a simple MoM and YoY Web KPI dashboard we can build and use in Google Looker Studio.
In conclusion, implementing a Digital Analytics Measurement Model empowers businesses to manage the complexities of continuous optimisation and improvement of the digital experience with clarity and precision. By tracking key metrics throughout the customer journey, from awareness to purchase, organisations can optimise engagement, conversion rates, and overall digital experience.
For next steps, I recommend:
- Conducting a comprehensive audit of your current digital analytics setup to identify gaps and opportunities for improvement.
- Developing a tailored action plan to integrate advanced analytics tools such as Google Analytics and Google Tag Manager, a CDP, an optimisation tool and marketing automation platform to enhance data collection and analysis.
- Continuously monitor and iterate your digital marketing efforts based on insights derived from key metrics, ensuring alignment with business objectives and fostering continuous improvement.
Contact us for more about how we can get you started with your digital optimisation strategy.